Ontario Frost-Free Season (FFS)
Cited by the Ontario’s Climate Act From Plan to Progress Report by the Environmental Commissioner of Ontario (ECO, 2017)
CONTEXT
The frost-free season (FFS) is defined as the number of days between the last spring frost and the first fall frost. Frost free period determines the length of time available for crop production, as well as the type of crops that can be grown in a particular region. The longer the FFS is, the longer the growing season will be. The length of the FFS influences strongly not only the growth of plants and seasonal activities of animals, but also the hydrological cycle and human activities [Yu et al. 2014]. Regionally, the number of frost-free days are projected to increase in all regions while significant increases in tropical nights are seen in southeastern North America, the Mediterranean and central Asia [IPCC AR5 2013].
To be aware of impacts of climate change on agriculture in Ontario, it is necessary to study the variation of FFS. This study investigates FFS changes over Ontario in historical period based on observed data and reanalysis data, and makes projections 0f FFS change in the future periods 2040-2060(2050s) and 2070-2099(2080s) relative to the reference period (1981-2005) under all RCPs based on a large ensemble of downscaled daily minimum temperature(20 models for RCP2.6; 28 models for RCP4.5; 15 models for RCP6.0 and 31 models for RCP8.5).
APPROACH
Downscaling, bias correction and FFS calcuation
Downscaling
Using a spatial-temporal varying transformation function to downscale GCM daily minimum temperature to ERA-Interim grid points. The transformation function is constructed based on the ERA-Interim reanalysis data for the period 1981-2010 and historical runs of CMIP5 GCMs (Deng el al. 2016). Thus, the spatial resolution of the downscaled data is ~10km.As an example, figure 1 shows a comparison of grid before and after downscaling.
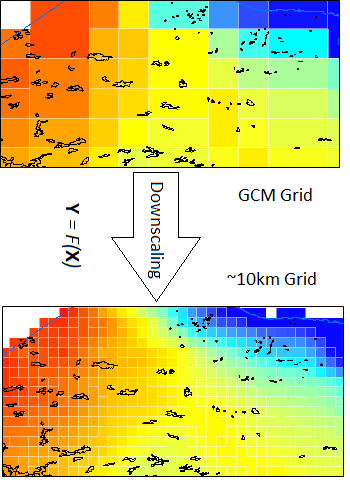
Fig.1 Downscaling schematic diagram
Bias correction
Empirical Quantile Mapping is used to correct bias in downscaled daily minimum temperature before it is used to calculate FFS. Fig. 2 shows the scheme of Bias correction. The blue line is the cumulative distribution function (CDF) of minimum temperature(Tn) at a grid point, the red and orange lines are the CDFs from downscaled Tn at the same grid point before and after bias correction.
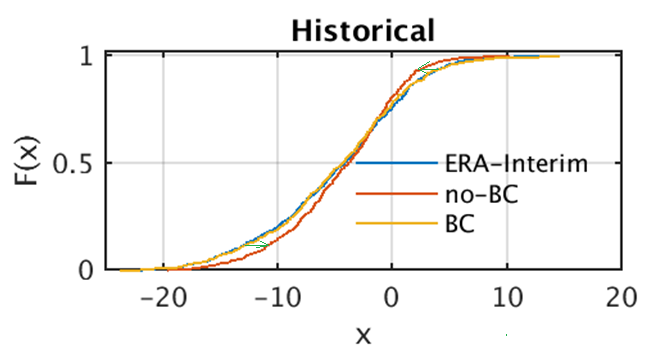
Fig.2 Bias Correction schematic diagram
FFS calculation
According to the definition of FFS, annual values of FFS are calculated at four selected stations and ERA-Interim grid points:
(1) Values of FFS at four stations are based on daily minimum temperature for the period 1979-2016.
(2) Values of FFS from ERA-Interim reanalysis data are calcualted and historical trend at each grid point are estimated as well.
(3) Values of FFS from bias-corrected downscaled daily minimum temperture from CMIP5 GCMs are calcuated.
(4) 30-year ensemble means of FFS for the four RCPs (RCP2.6,RCP4.5, RCP6.0 and RCP8.5) are estimated for 2050s (2040-2069) and 2080s (2070-2099).
(5) Changes of 30-year ensemble means of FFS relative to the reference period (1981-2005) for the four RCPs are estimated for 2050s and 2080s.
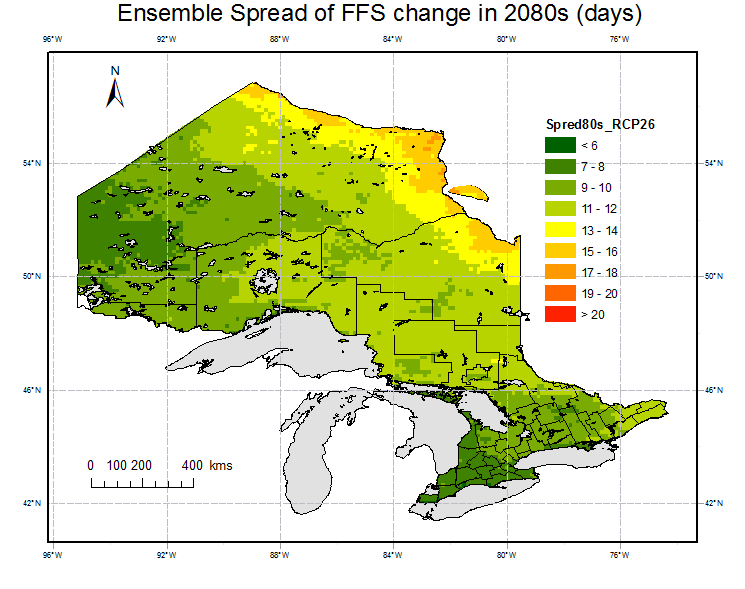
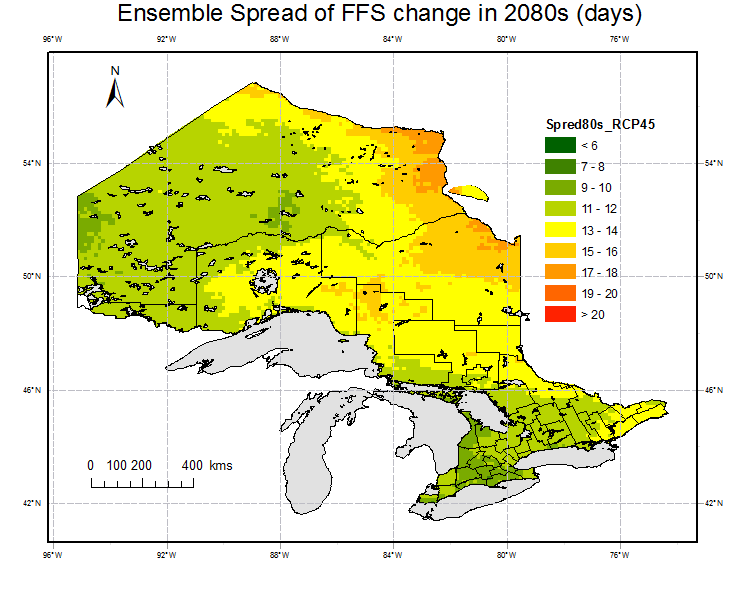
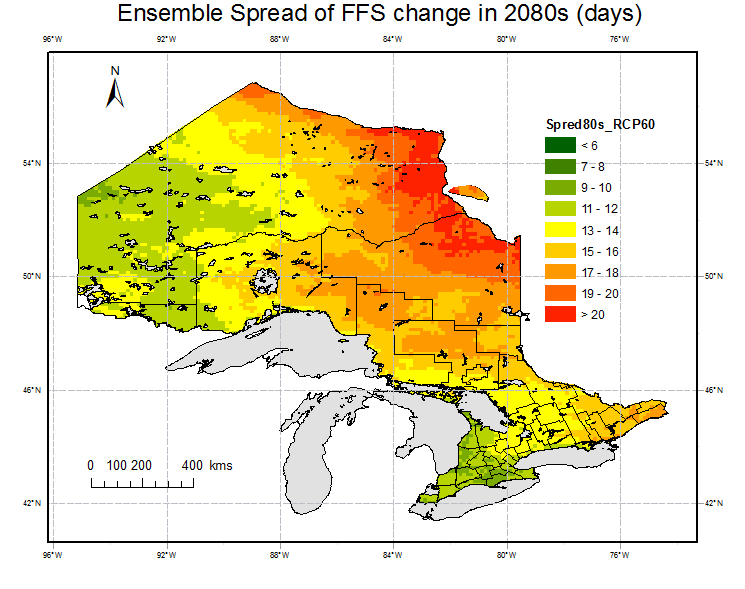
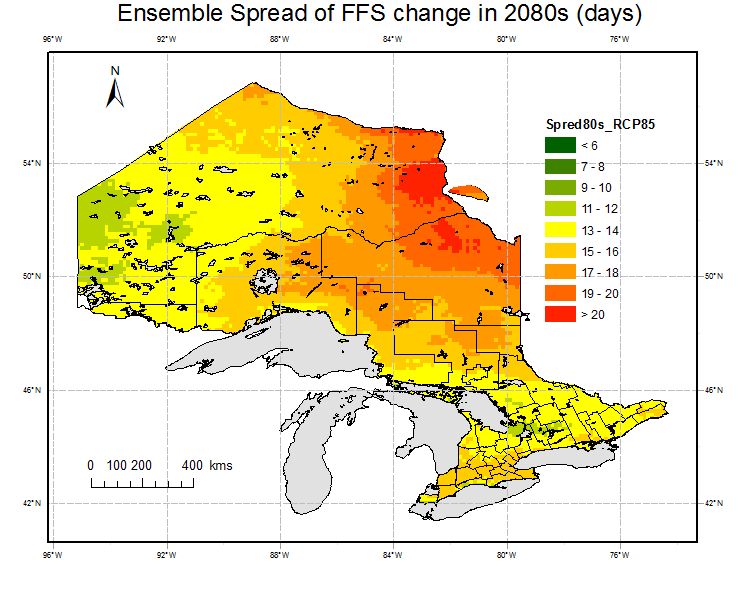
(6) Ensemble spread of FFS changes for 2080s are estimated to characterize the uncertainty of the projections.
RESULTS
Observations
Annual values of FFS are calculated at four selected weather stations, Toronto (79.617W, 43.667N), Ottawa (75.717W,45.383N), Geraldton (86.917W, 49.767N) and Red Lake (93.783W, 51.067N). There are significant differences among the stations not only in average, but also in trend. The results are shown in figure 3.
(1) Averaging over the last 36 years (1981-2016), the mean values of FFS are 171 (min:134-max:199), 161 (136-186), 103 (80-135) and 113(87-140) days at the 4 statiions respectively.
(2) There is an upward trend in FFS by 1.05days/year, 0.25days/year, 0.94days/year and 0.36days/year at Ottawa, Geraldton and Red Lake, respectively
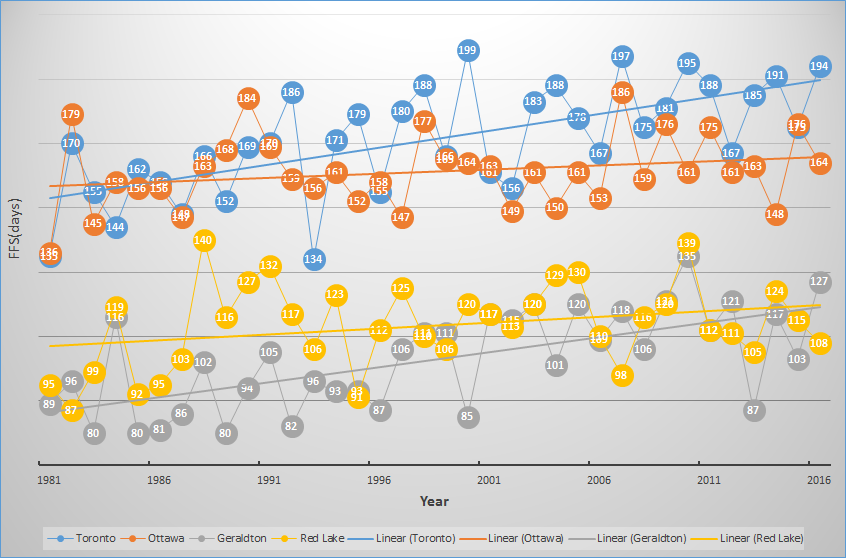
Fig. 3 FFS at four weather stations for the period
Reanalysis
Based on daily minimum temperature of ERA-Interim dataset, annual values of FFS are calcuated at 8964 grid points within Ontario for the period 1979-2017. Averages for the reference period (1981-2005) and trends based on 39-year data are estimated and are shown in figure 4.Fig.4 shows that FFS vary significantly spatially and temporally in Ontario.The spatial pattern of FFS is similar to that of annual mean temperature which decrease from south to north and from west to east (Deng et al, 2016). The spatial average FFS for the reference period is 126 days in Ontario. Over most grid points, there are significant upward trends over the last 39 years except over some small areas in southen Ontario with slight downward trends.
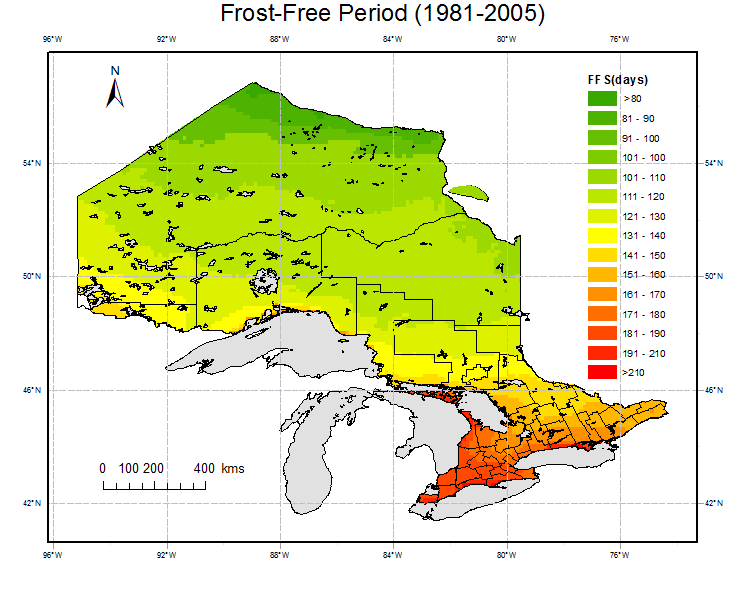
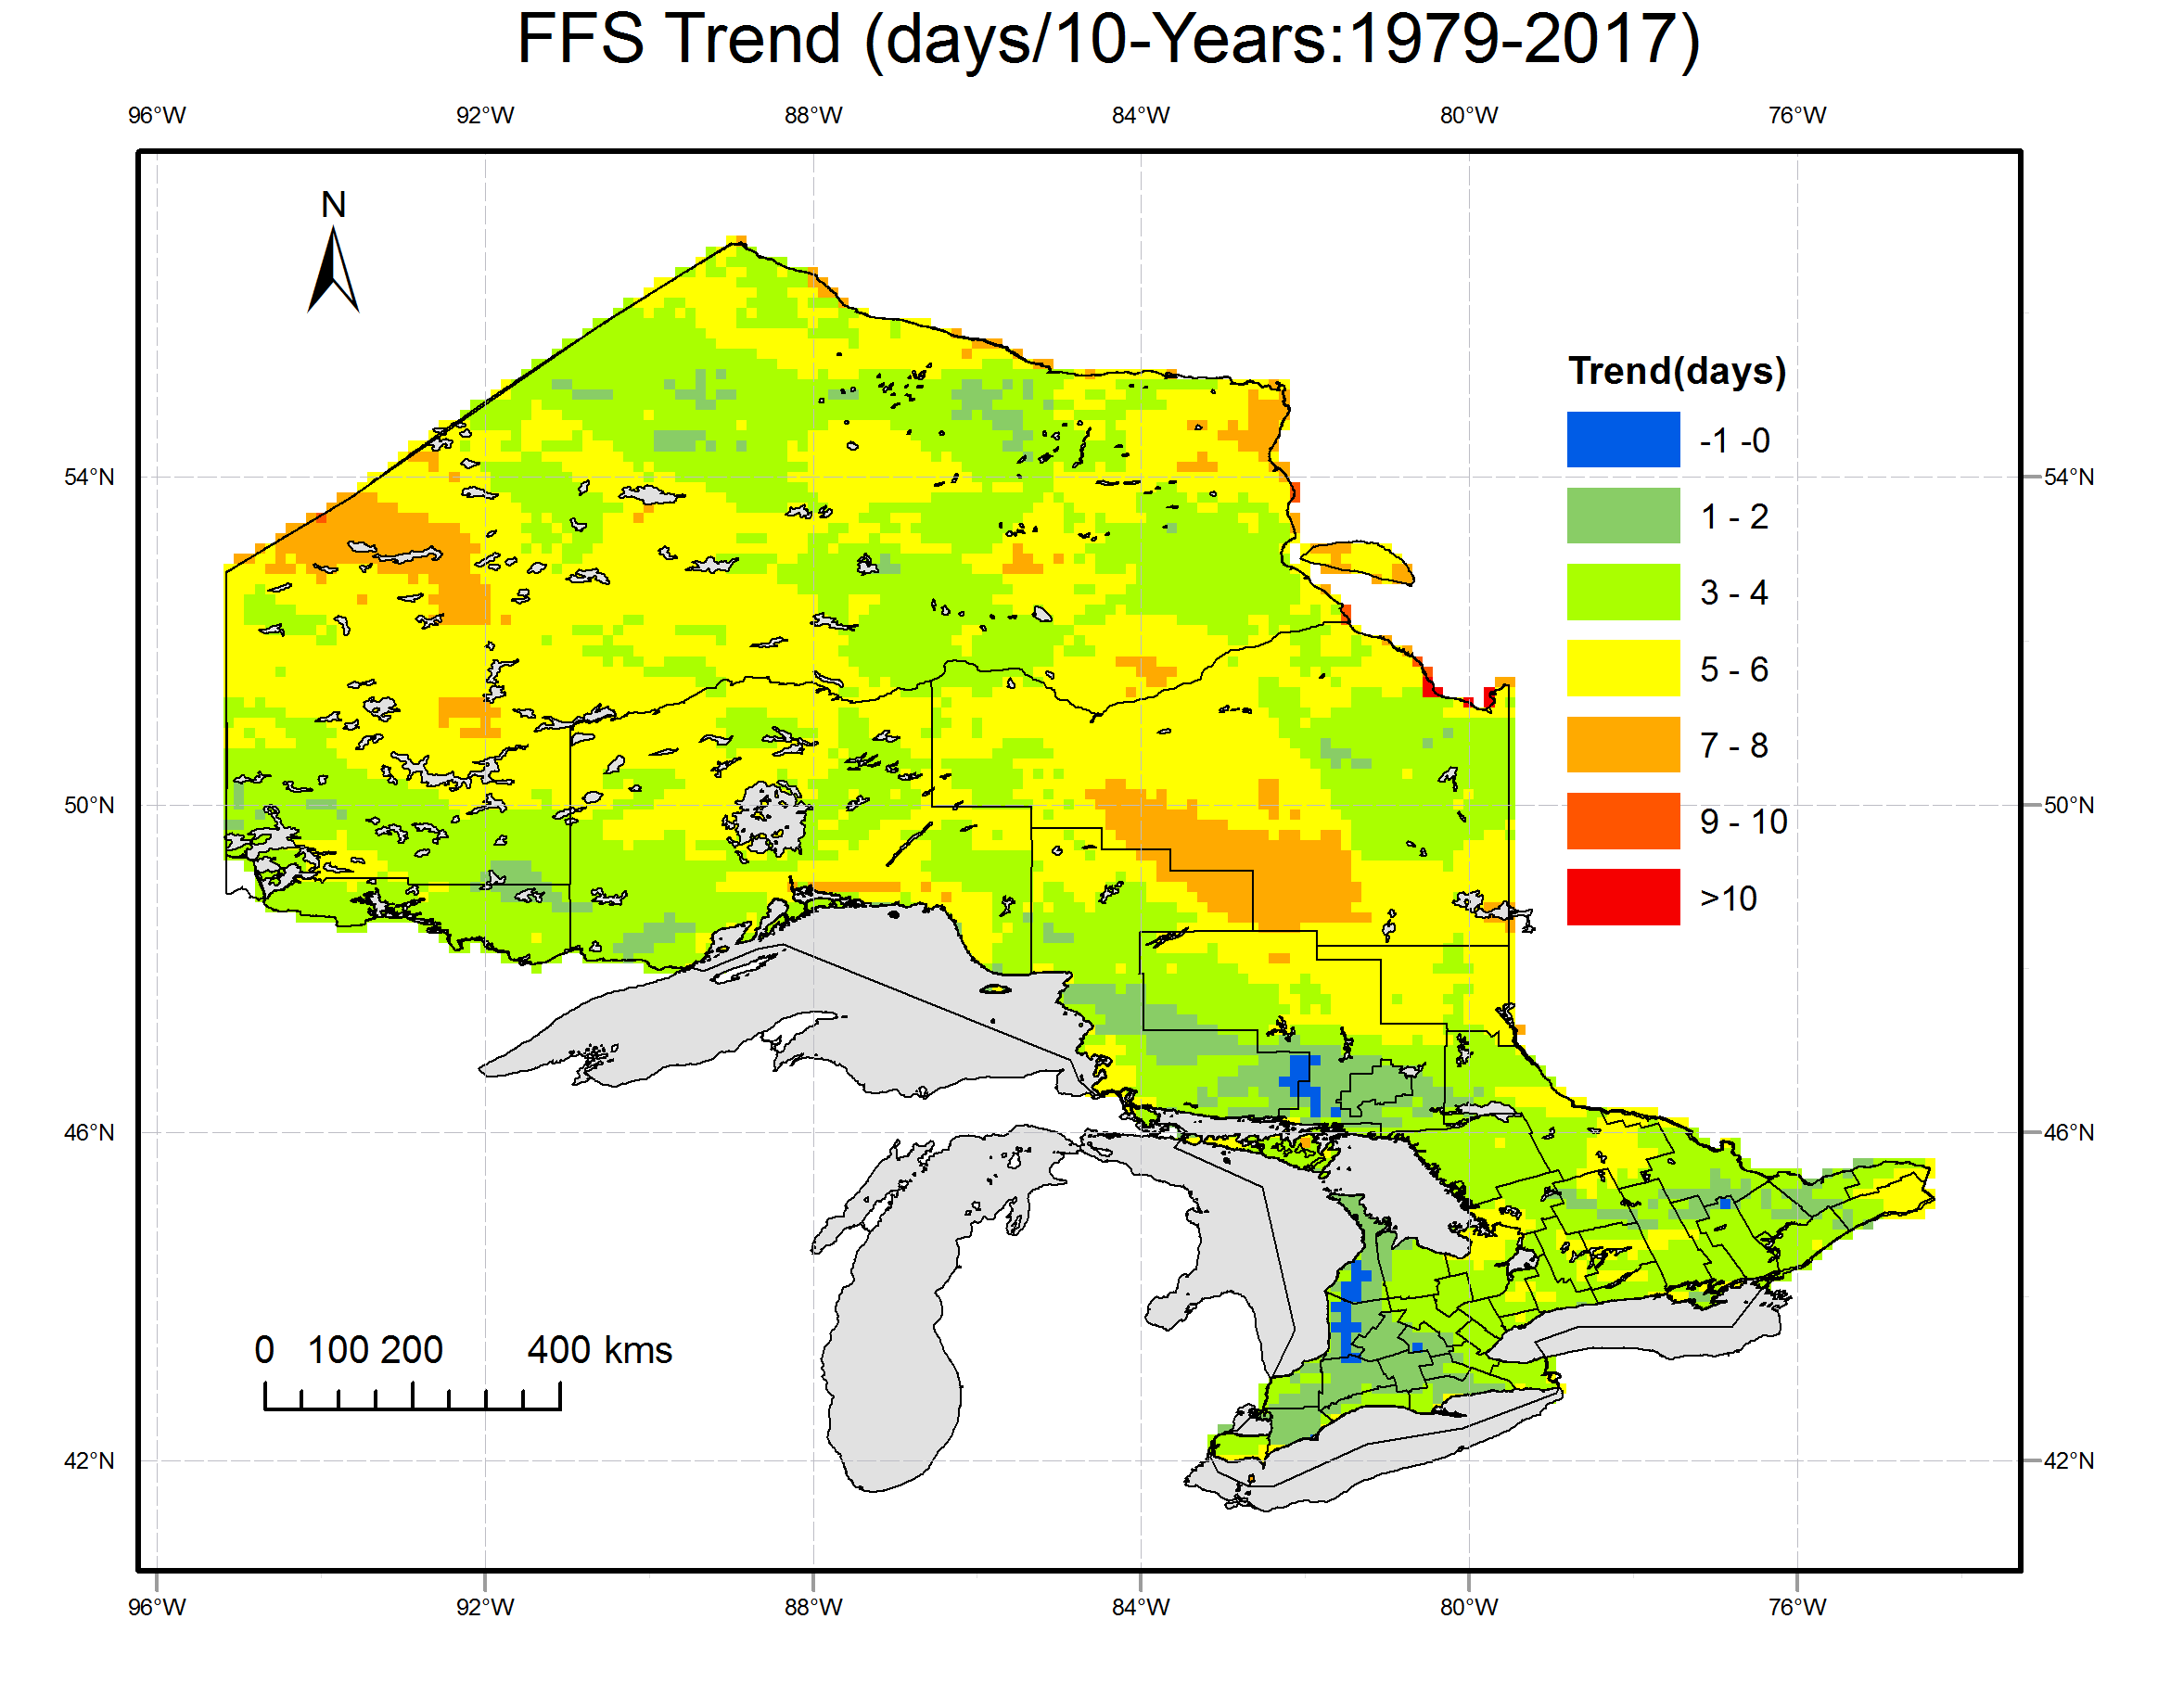
Fig. 4 Spatial distribution of averge (left) and trend (right) of FFS over Ontario based on ERA-Interim daily minimum temperature dataset.
Projections
To estimate impacts of climate change on FFS in Ontario, projections are generated based on bias-corrected downscaled daily minimum temperature data. Outputs of 20, 28, 15 and 31 CMIP5 GCMs under RCP 2.6, 4.5, 6.0 and 8.5 are used. Time series, period average and uncertainty (ensemble spread) are examined.
Fig. 5 shows simulated time series of change in FFS at the 4 grid points nearest to the 4 selected weather stations. It is observed that there are significant up trends under all RCPs. Before 2040, the trends are similar among the 4 RCPs. Then, there are very obvious differences in trend among the RCPs.
Fig. 6 shows the spatial distribution of the changes in the period 2050s and 2080s relative to the reference period (1981-2005). FFS is projected to increase in 2050s and 2080s over all grid points in Ontario. Averaging over all grid points, FFS is projected to increase relative to the reference period under all of the RCPs in future. The increasing amplitudes are 16 (13%) and 16 days (13%) under RCP2.6, 19(15%) and 26 days (20%) under RCP4.5, 20 (16%) and 32 days (26%) under RCP6.0 and 28(22%) and 48 days(38%) under RCP8.5. It is observed that the maximum increases happen in area close to large water body, e.g.,the areas around Lake Superior in the southwest and around Hudson Bay in the northeast. In the northwestern mountainous areas, the increase amplitude is relative small compared to other areas. Except for RCP 2.6, the increase in 2080s are significant compared to 2050s.
Fig. 7 shows the ensemble spread which characterize the uncertainty in some extent. It is obvious that there are relative large uncertainties in FFS estimation in the central Ontario, expecially area around Hudson Bay.
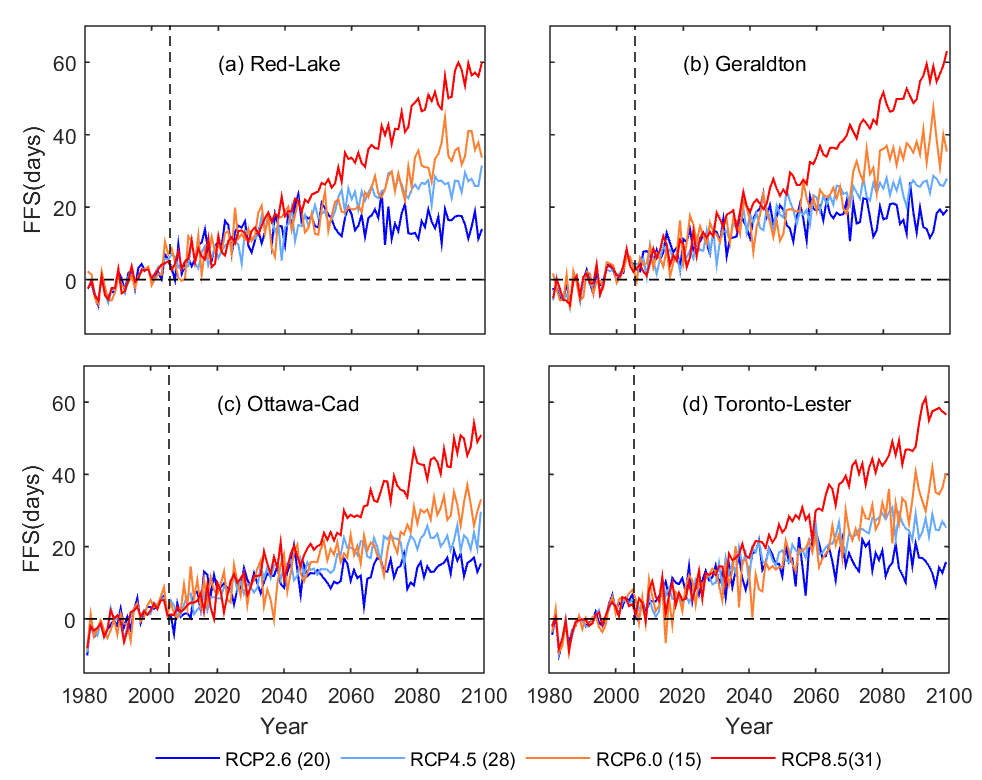
Fig. 5 Ensemble mean of change in FFS relative to the reference period 1981-2005 at four grid points nearest to the correponding weather stations.


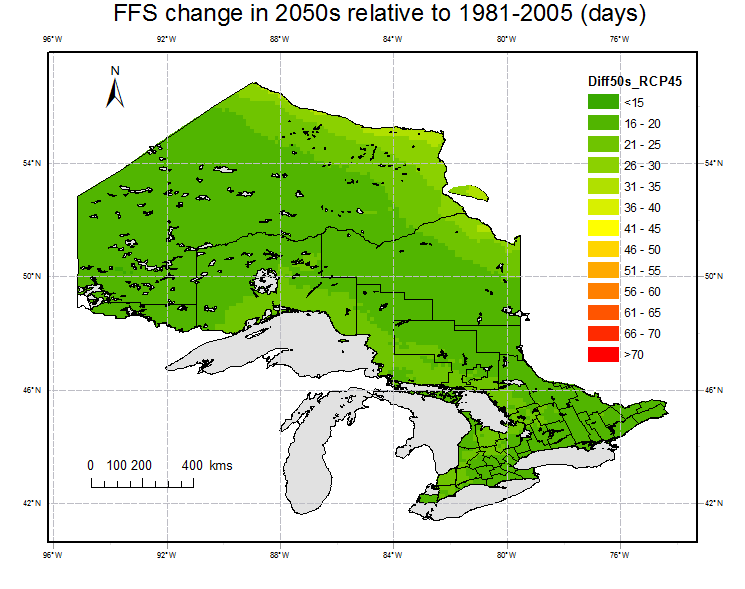


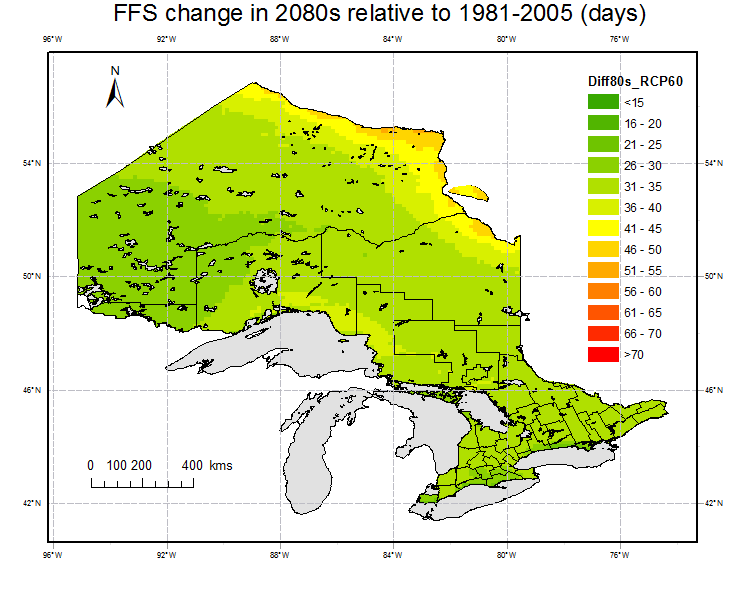

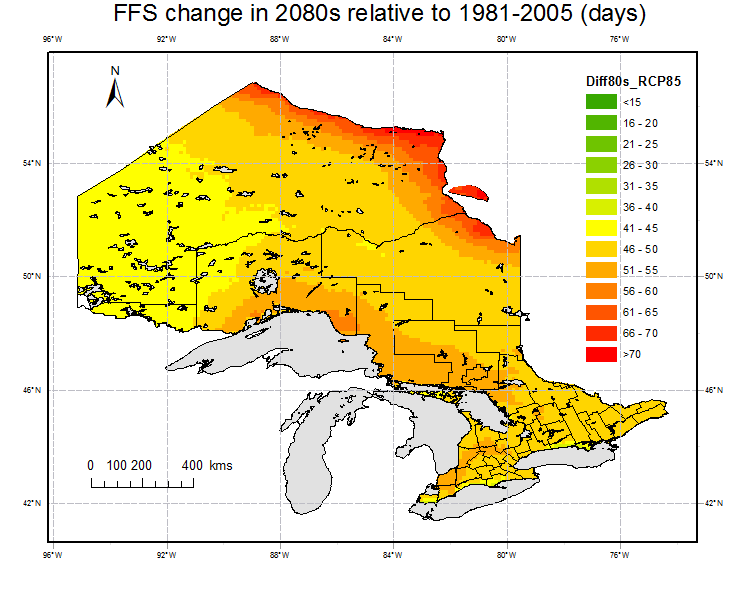
Fig. 6. Projections of changes in FFS for 2050s (left) and 2080s (right) under RCP 2.6, 4.5, 6.0 and 8.5 relative to the reference period (1981-2005).