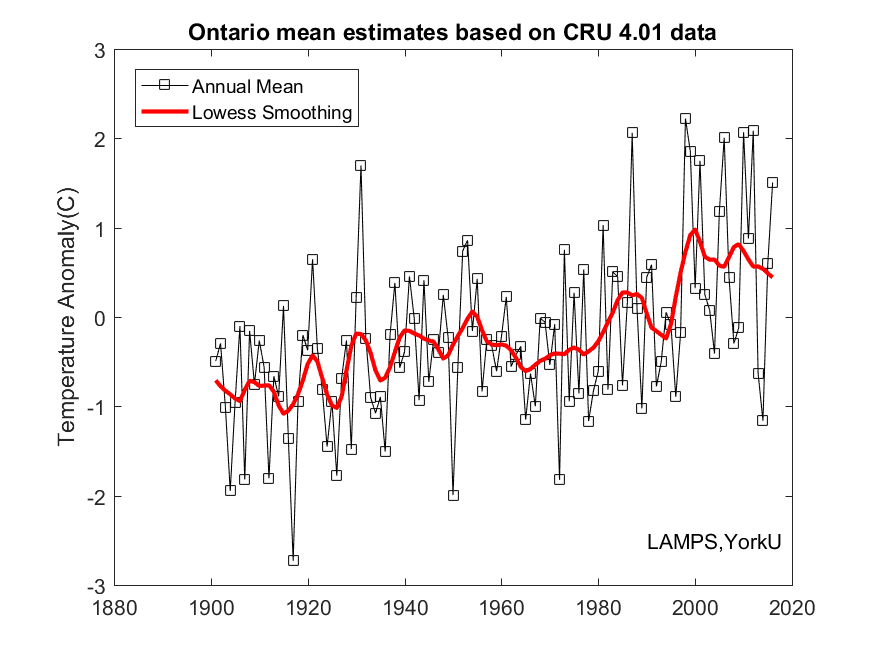
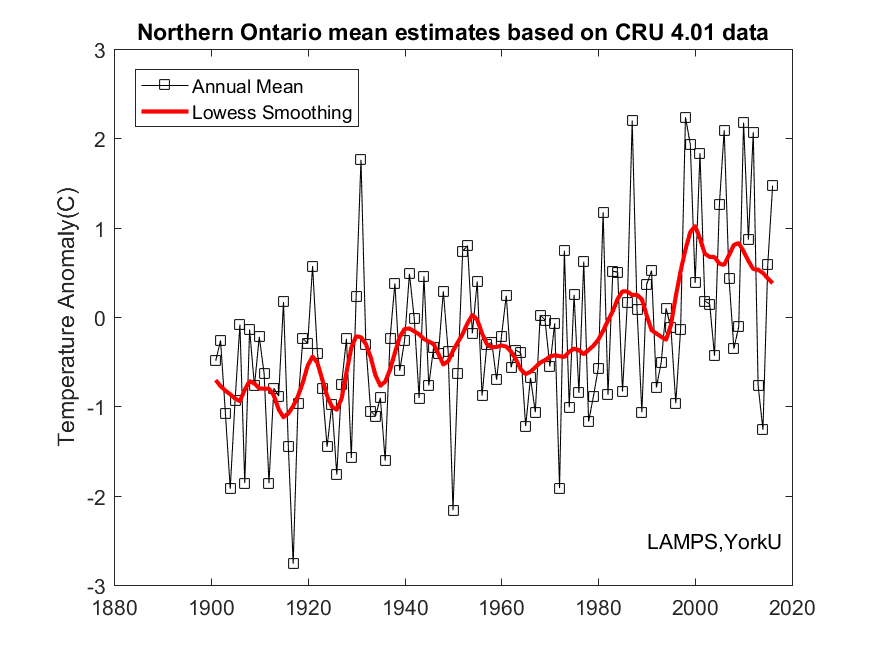
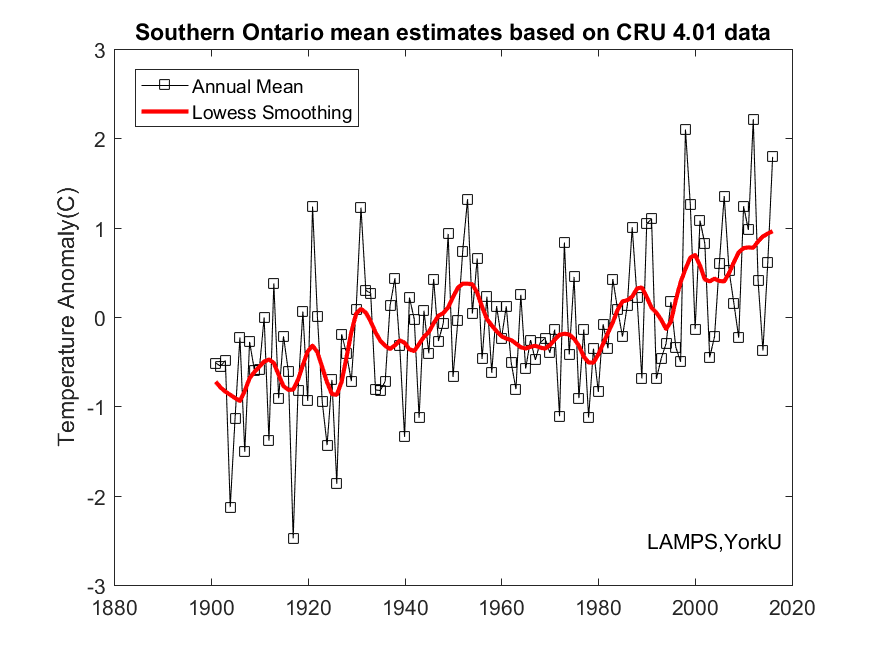
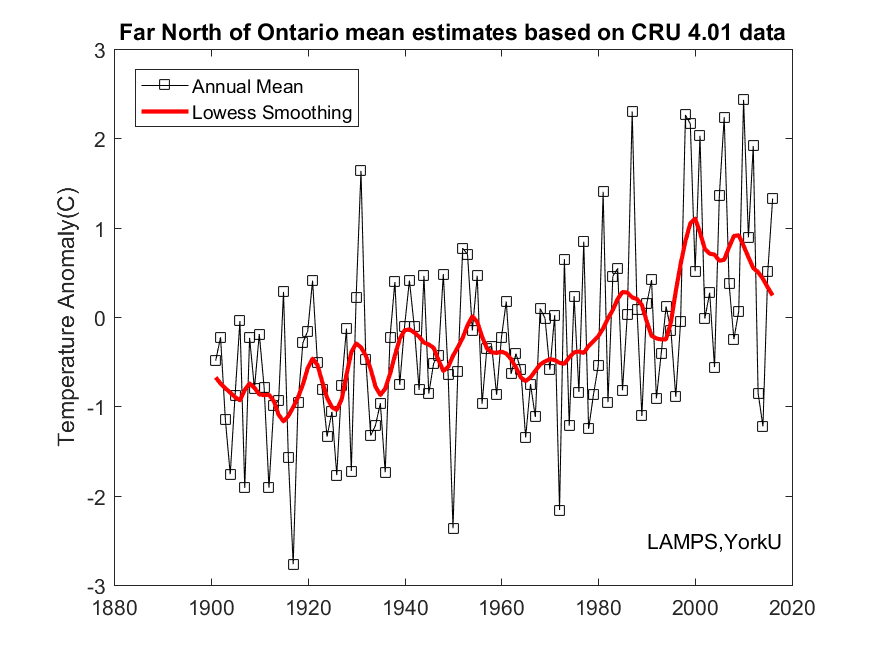
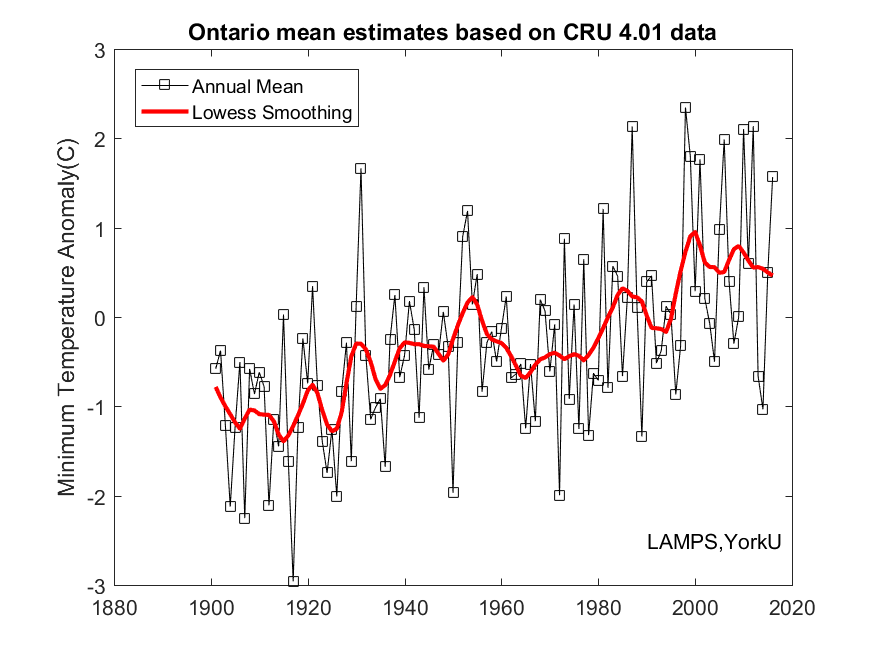
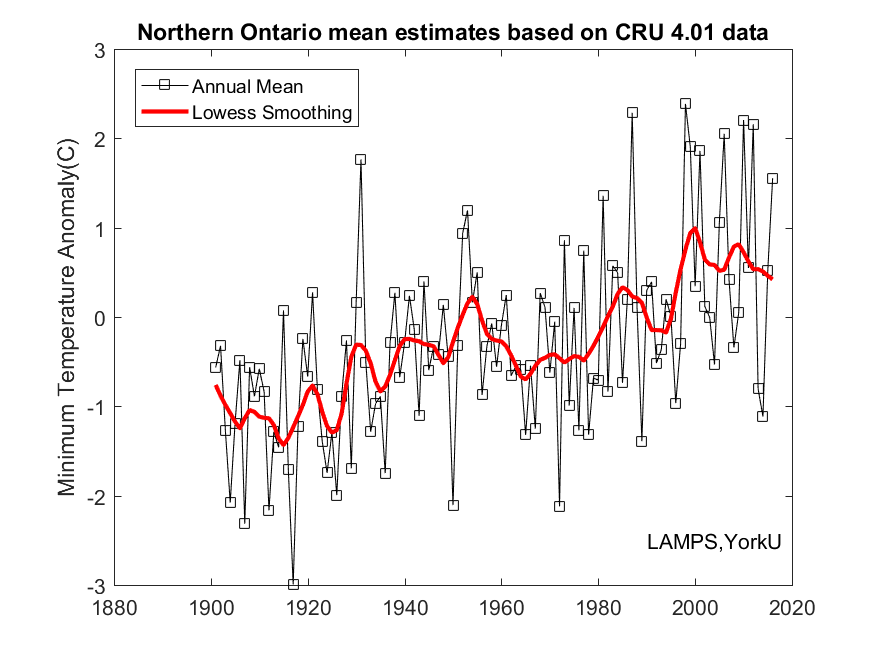
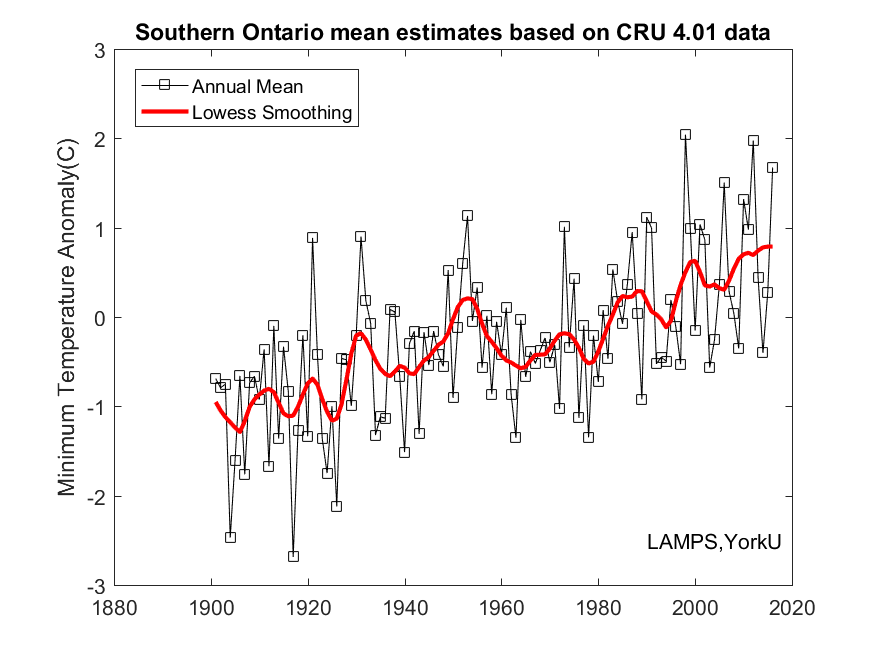
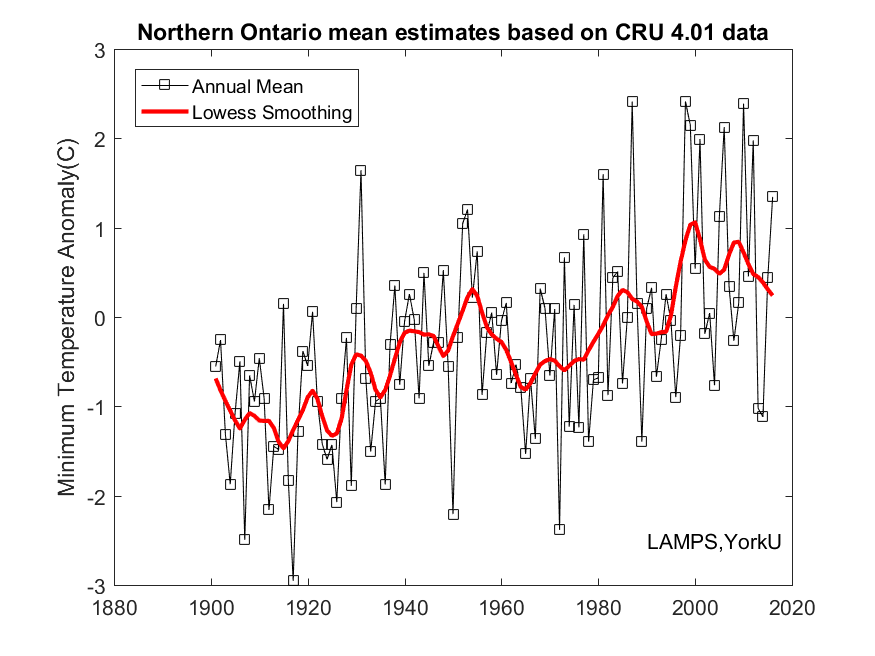
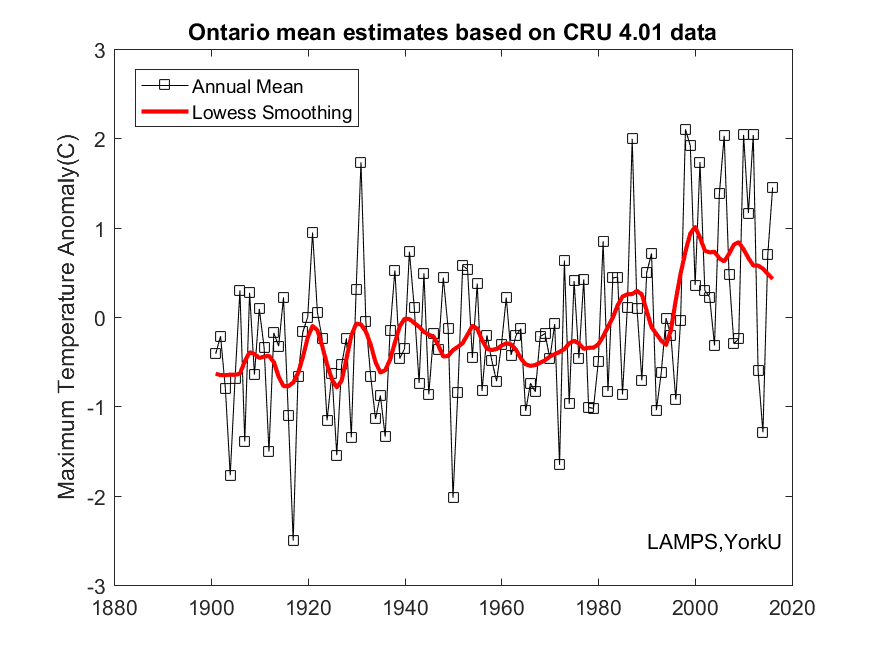
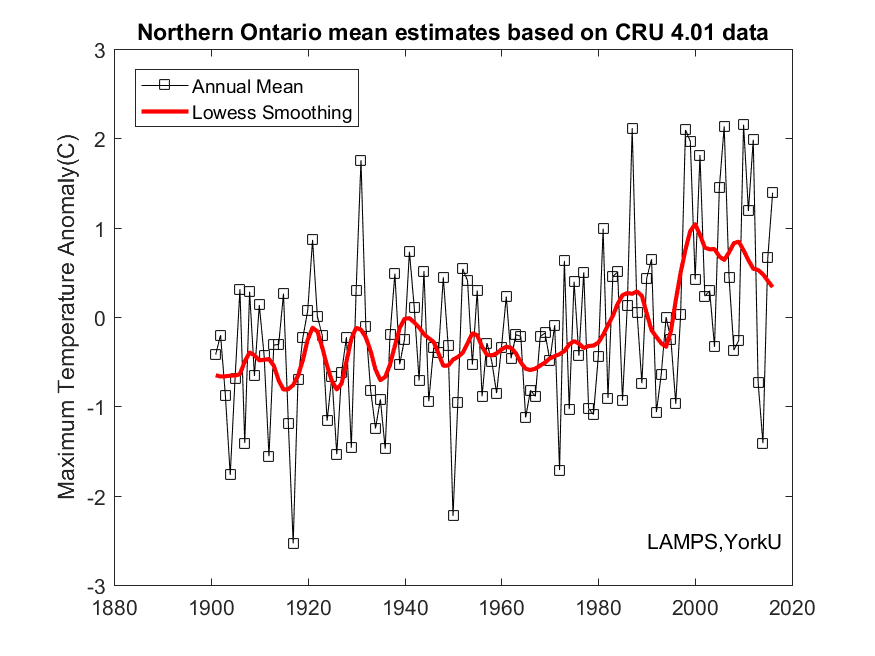
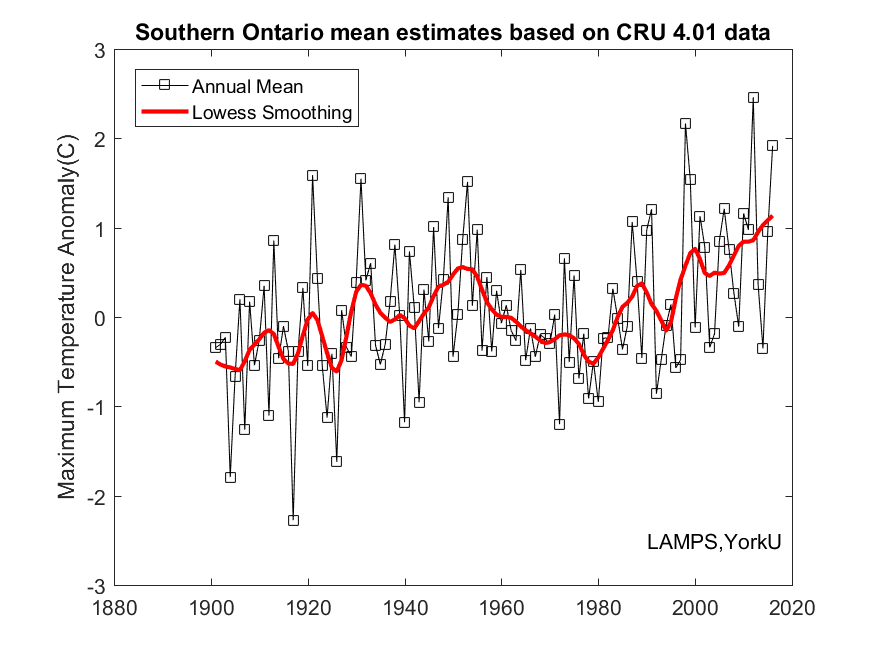
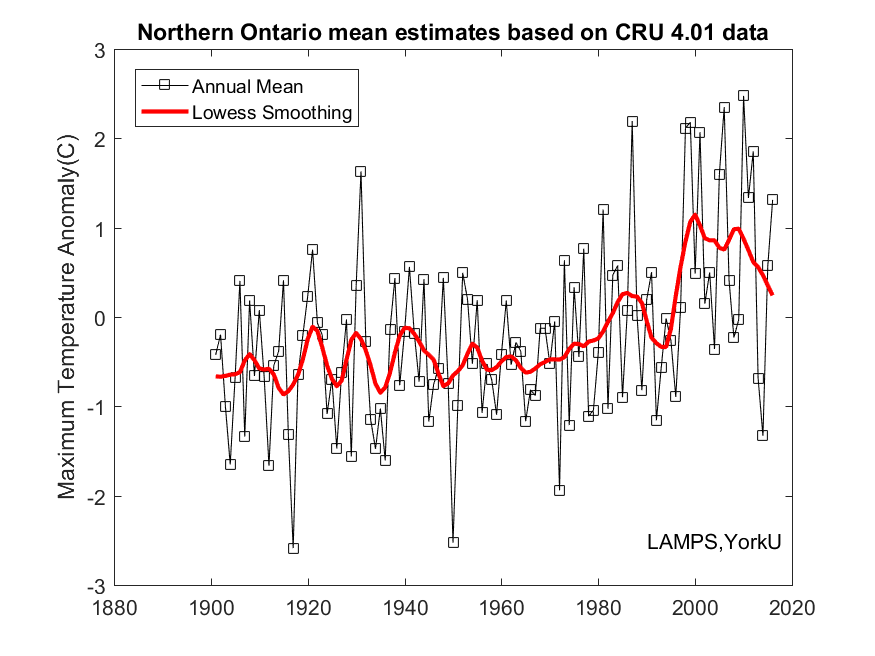
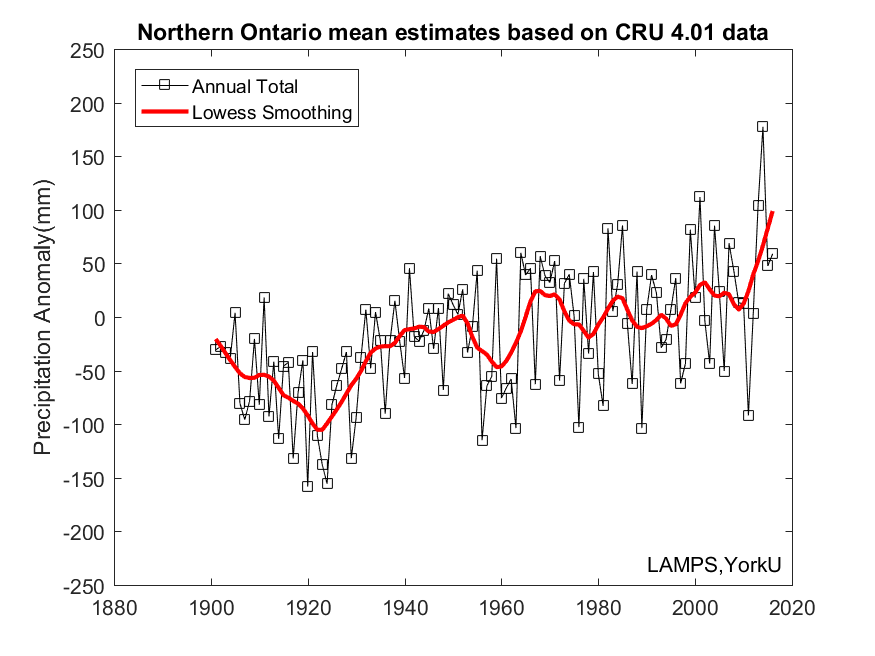
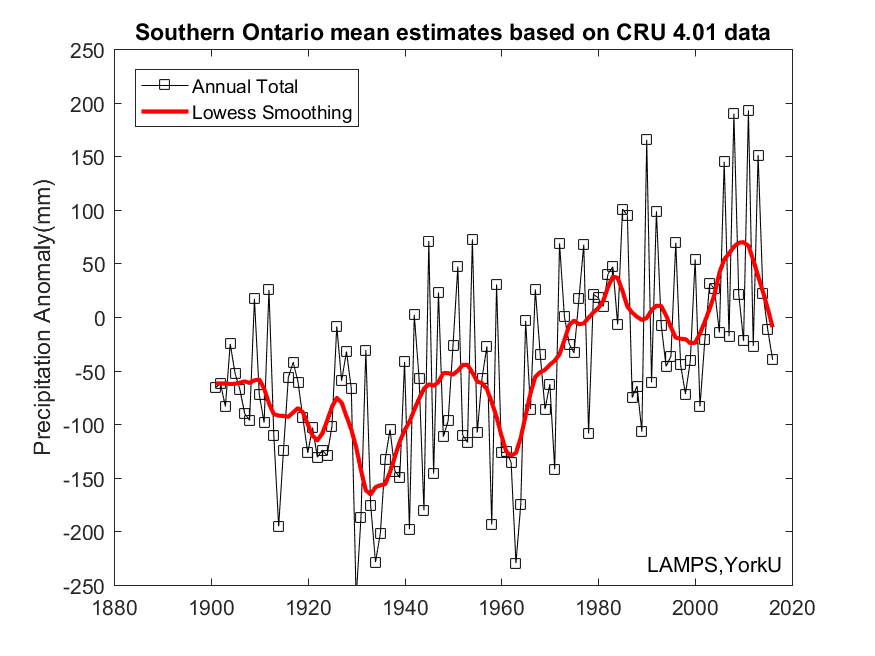
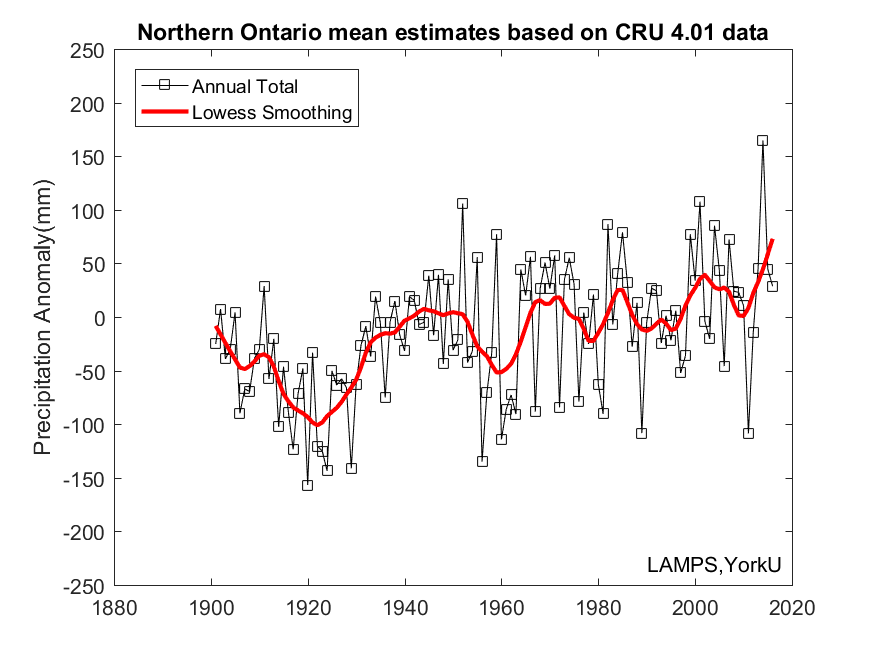
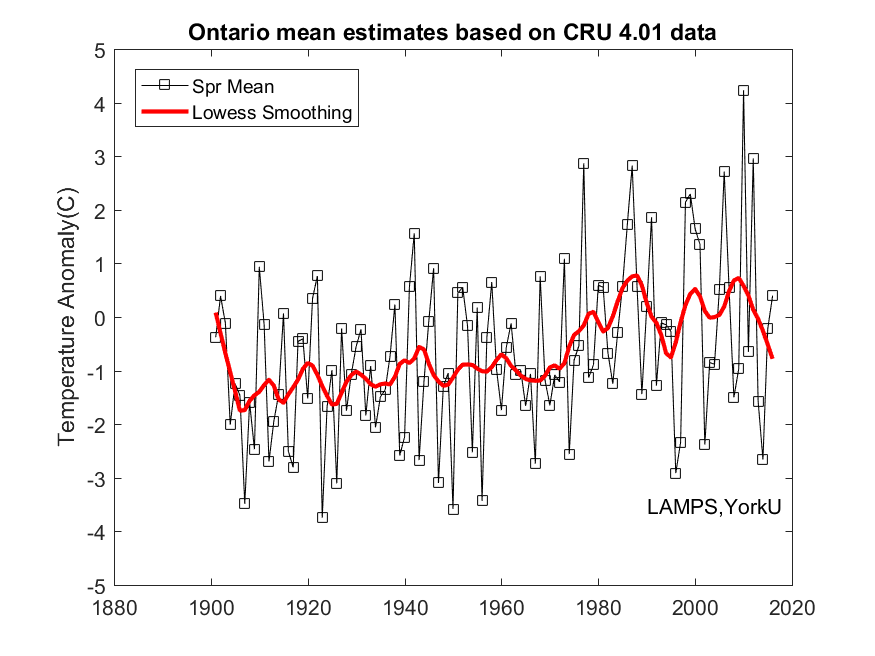
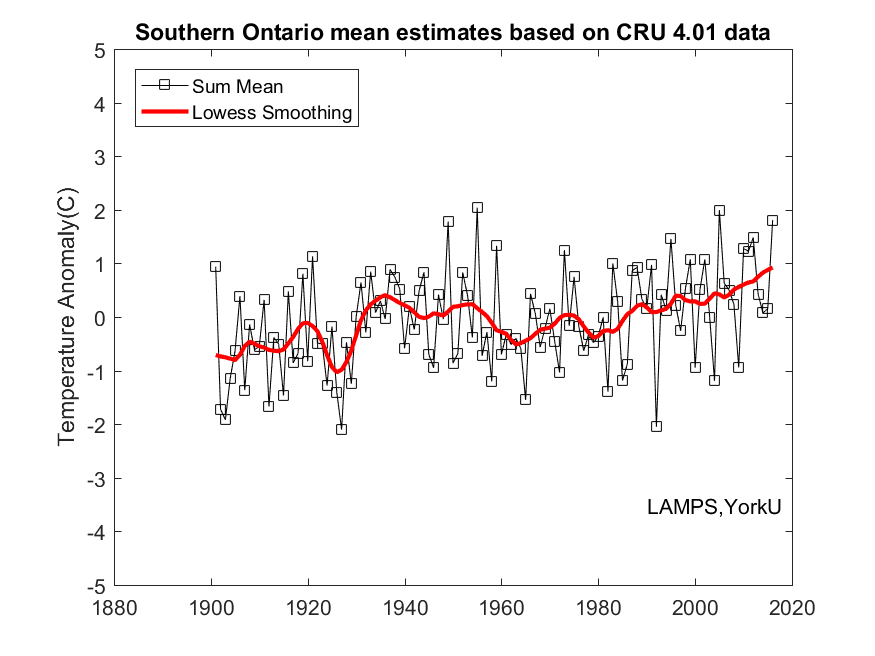
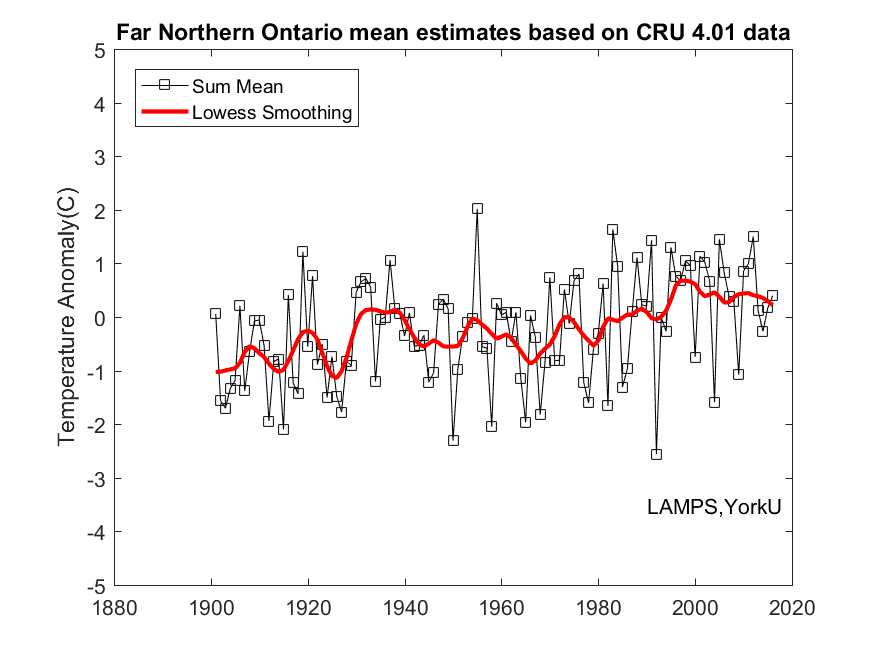
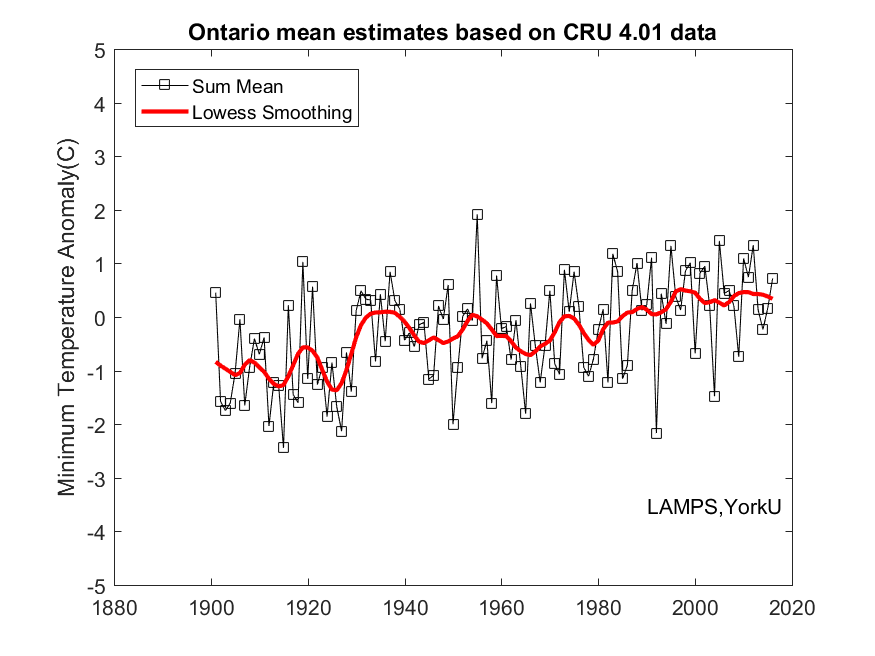
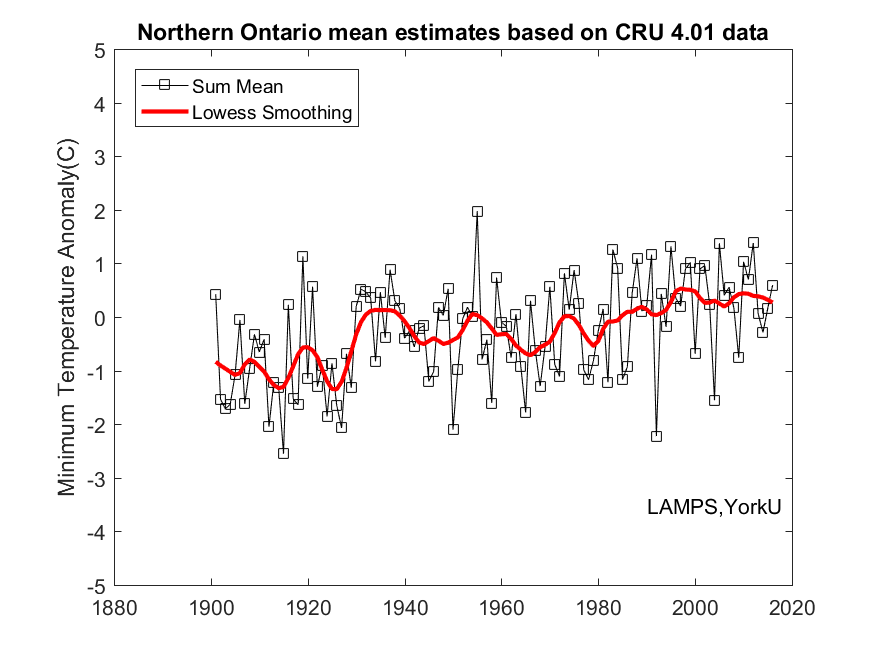
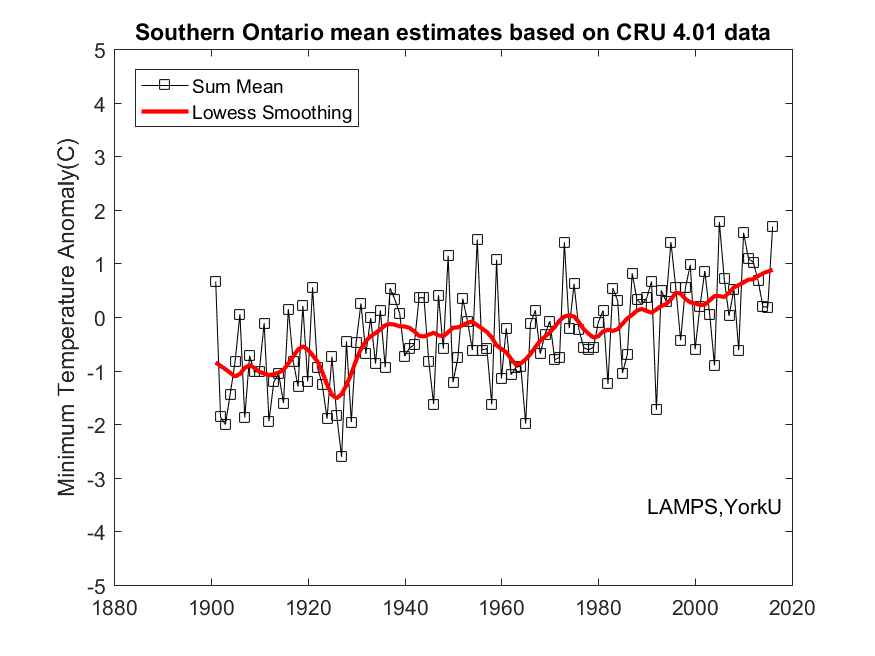
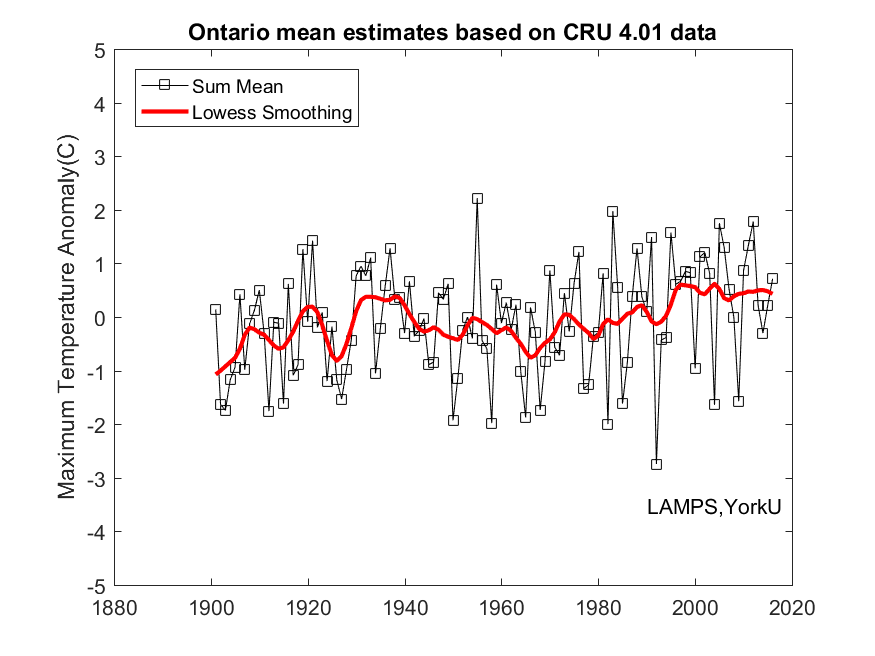
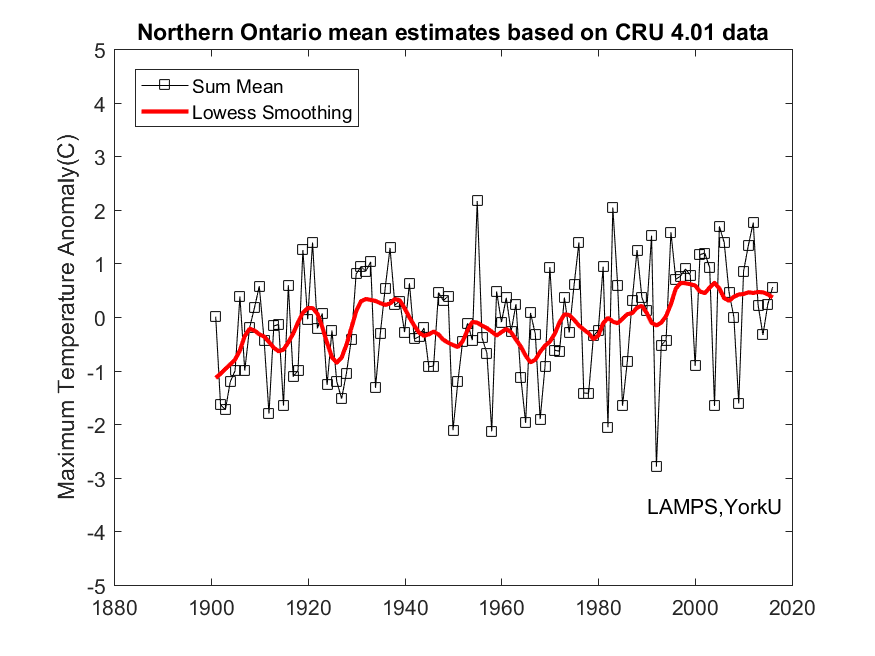
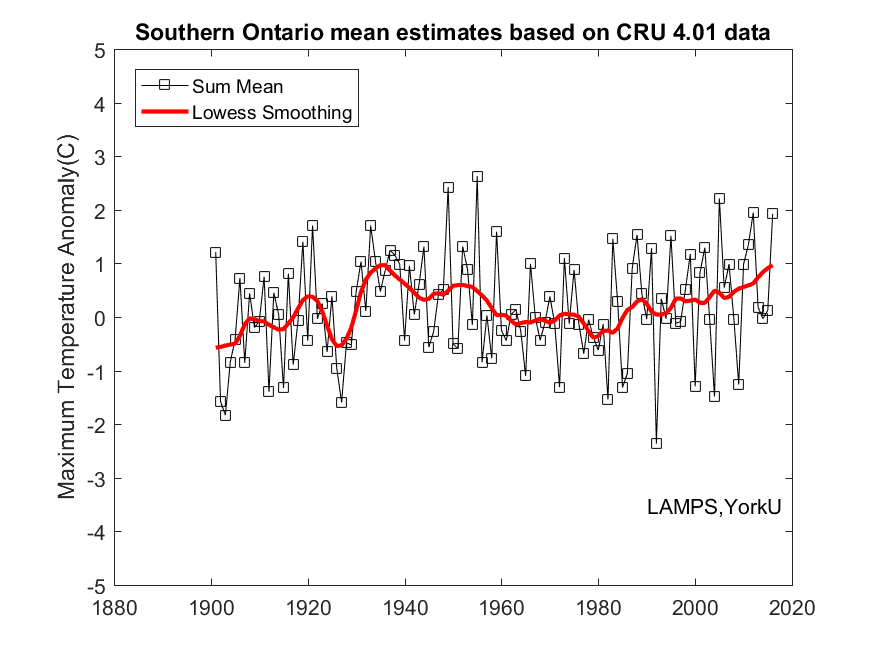
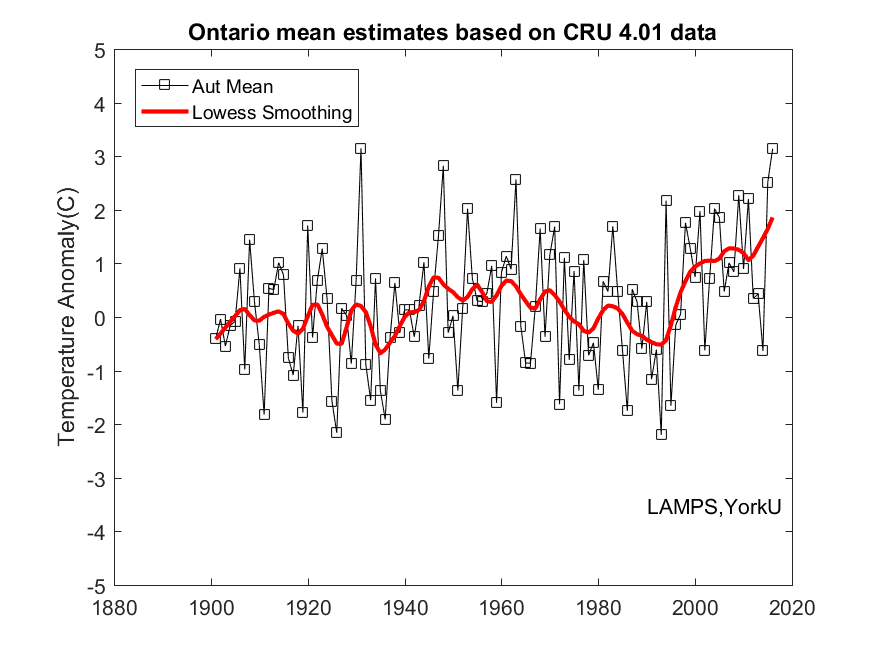
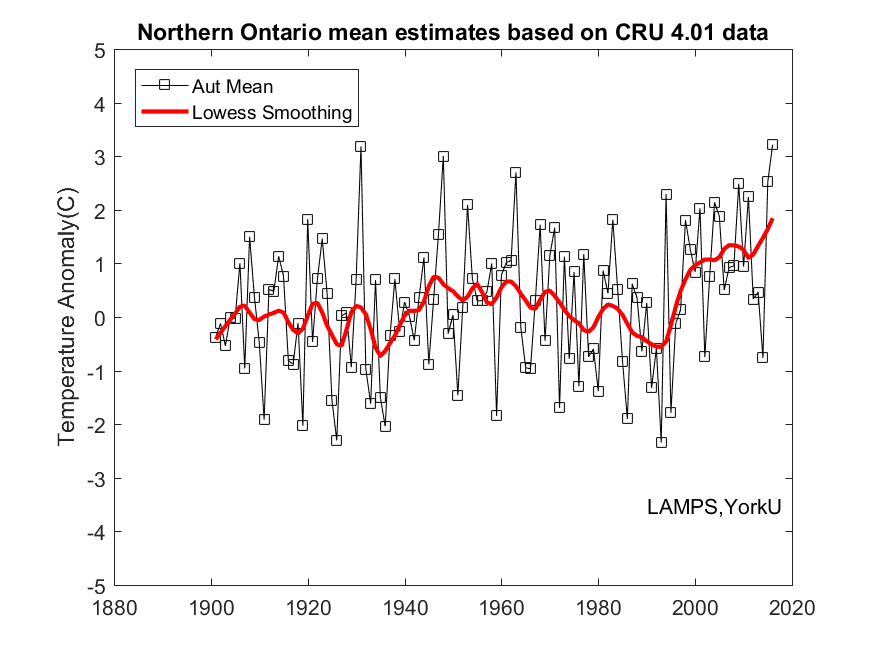
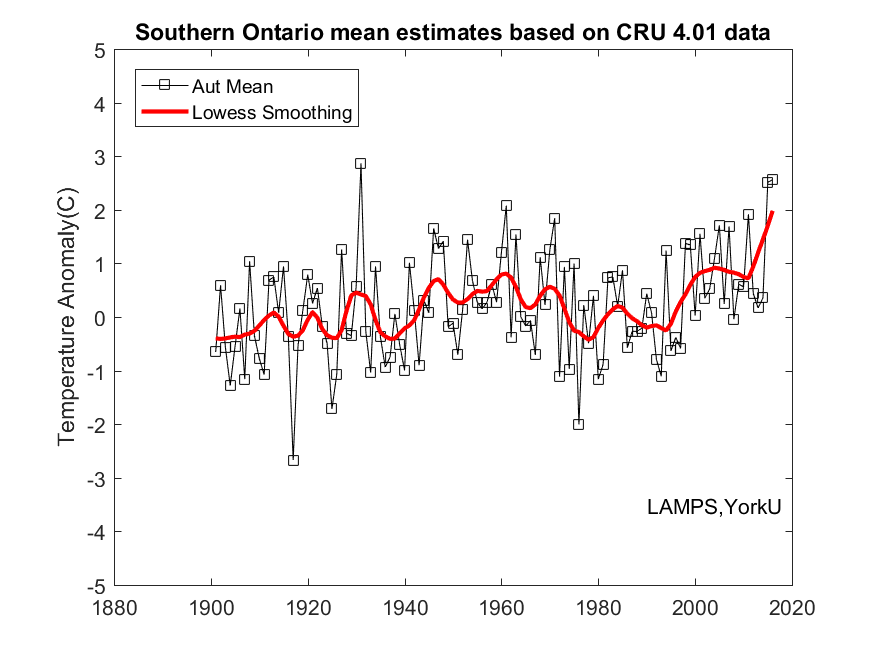
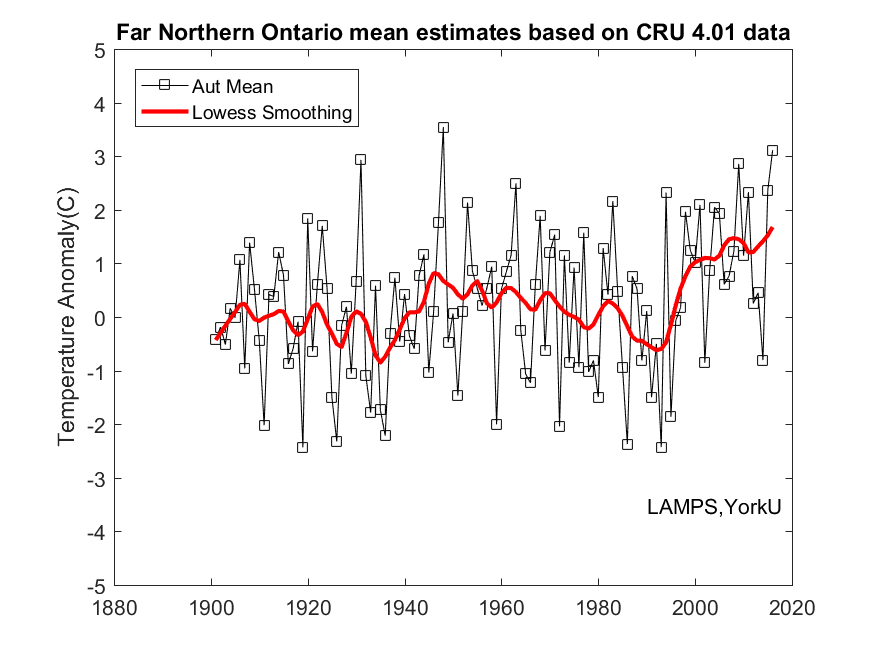
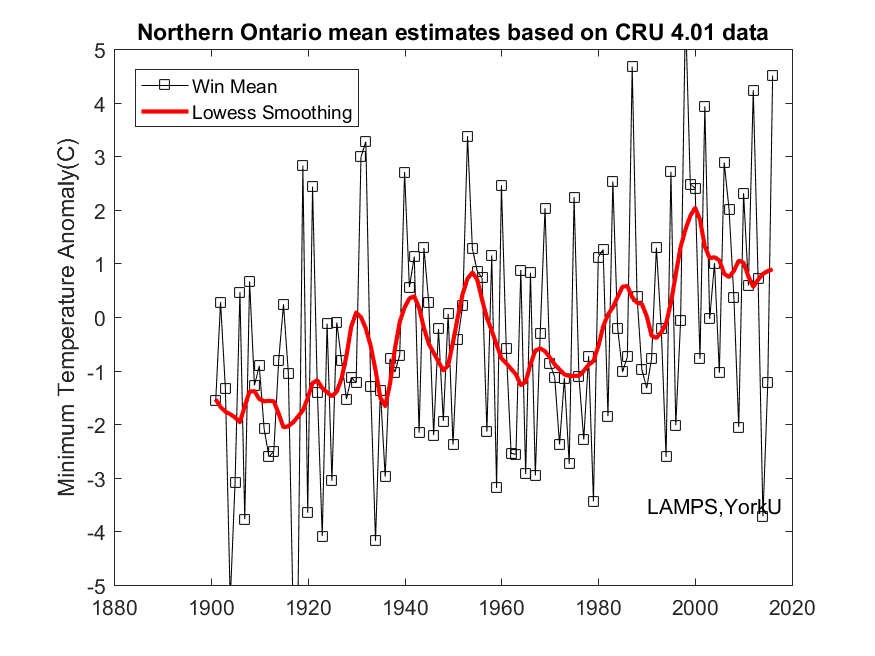
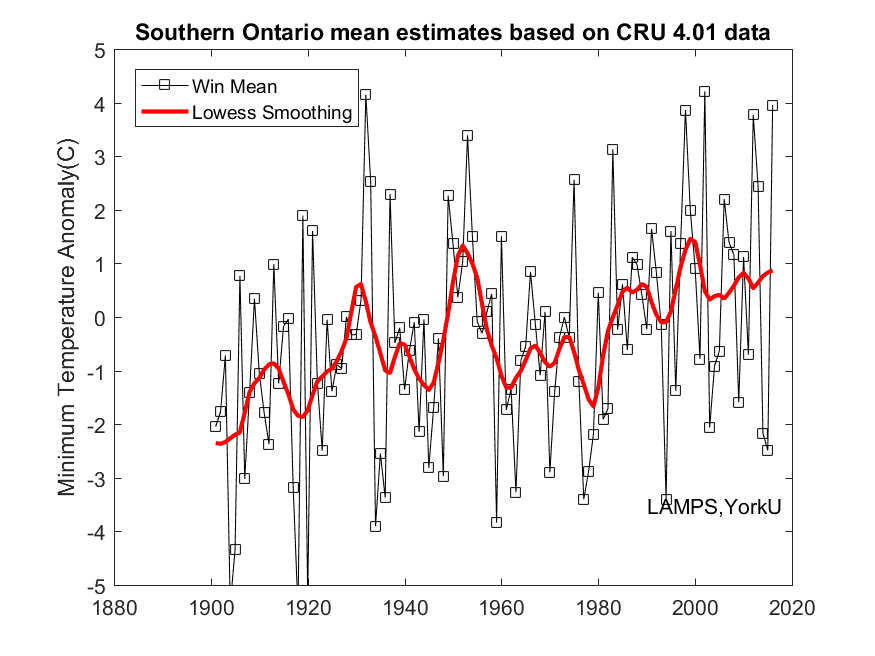
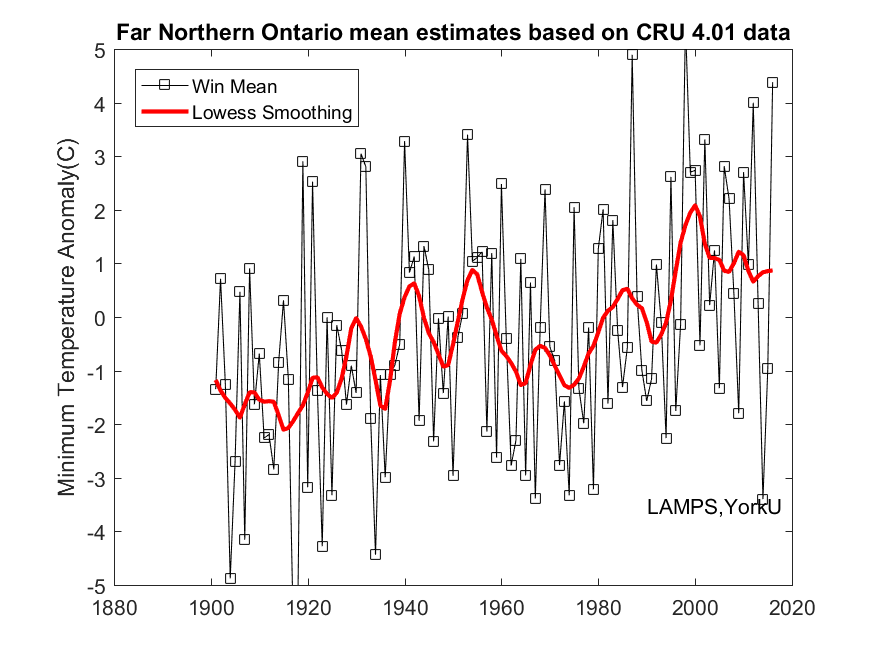
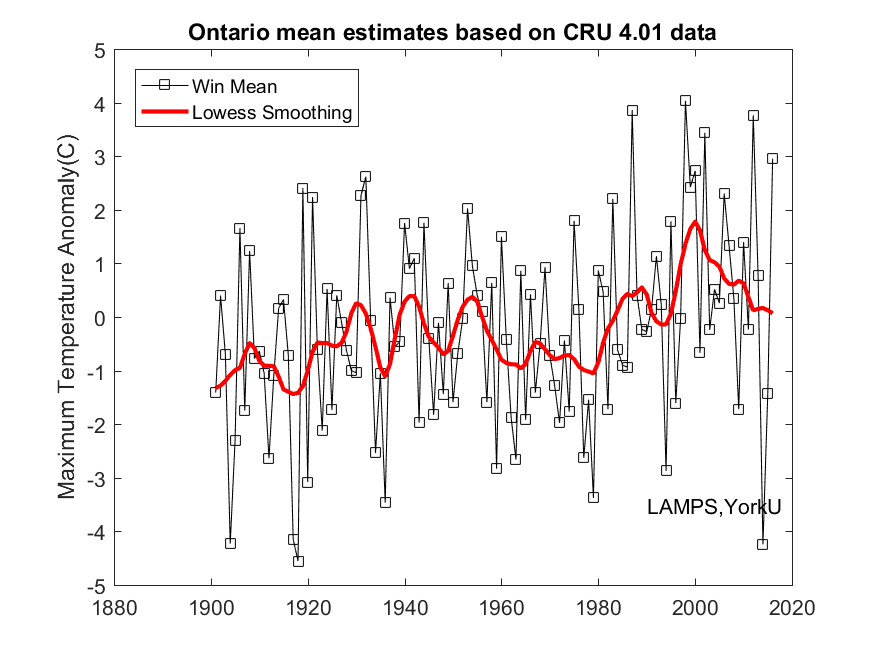
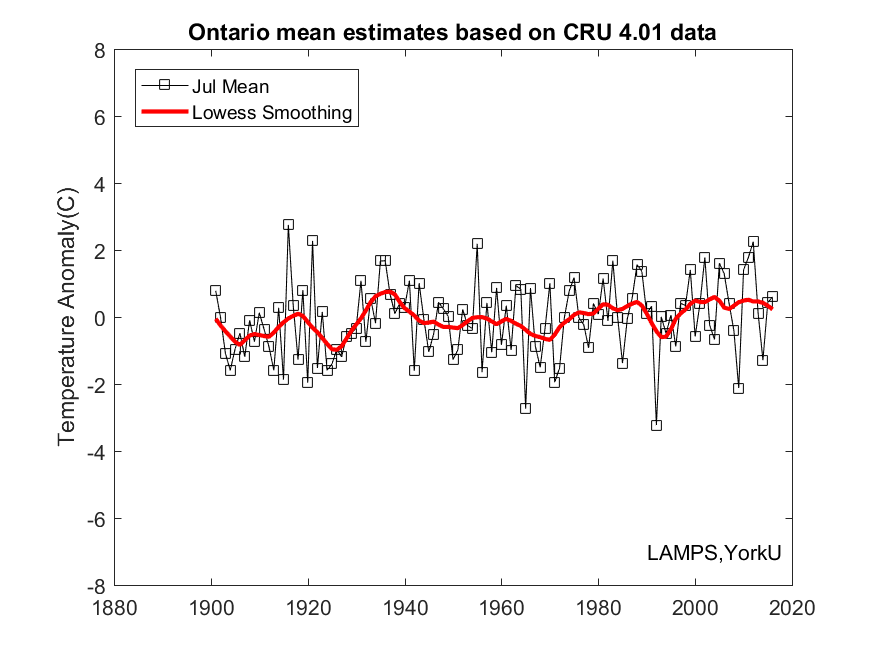
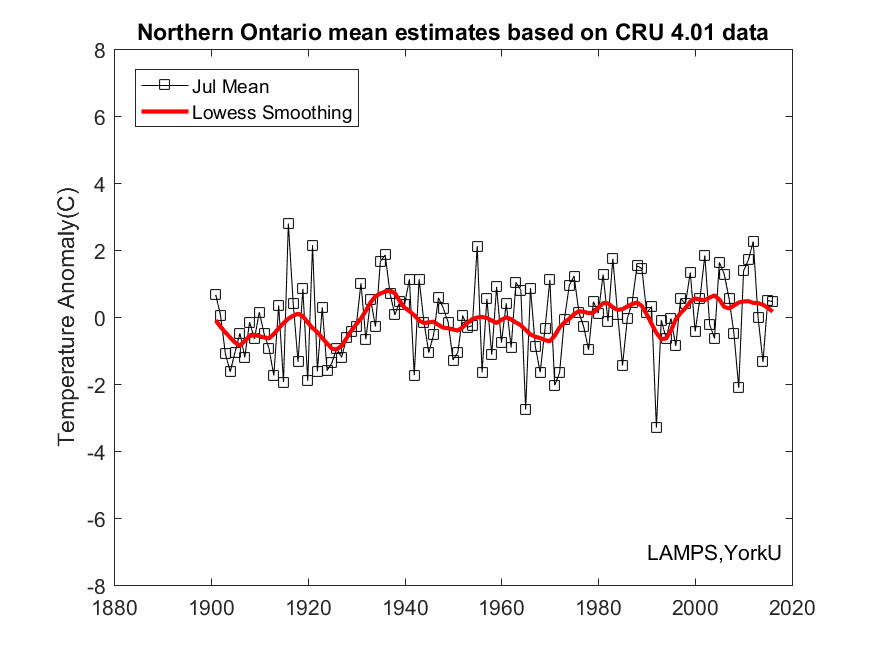
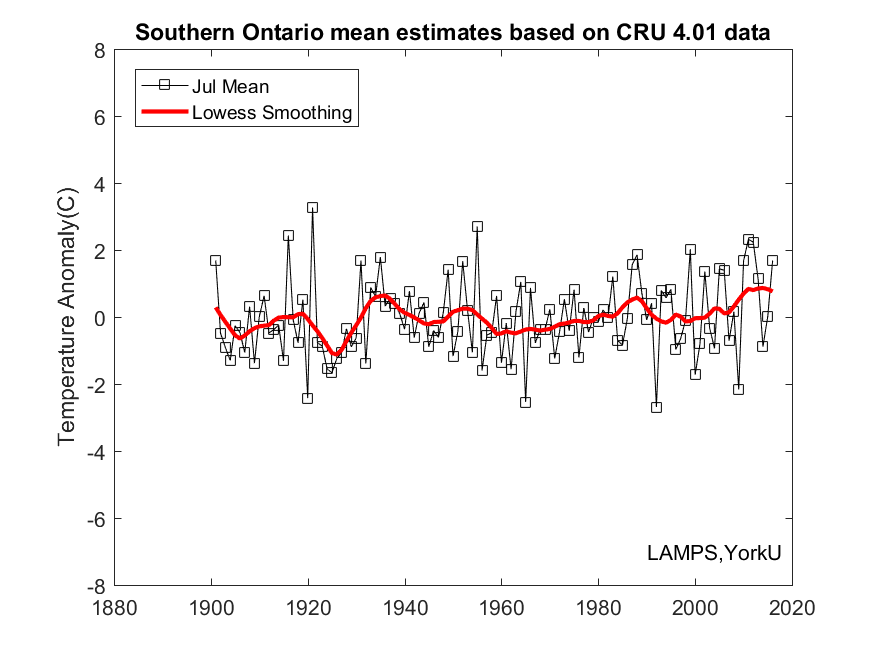
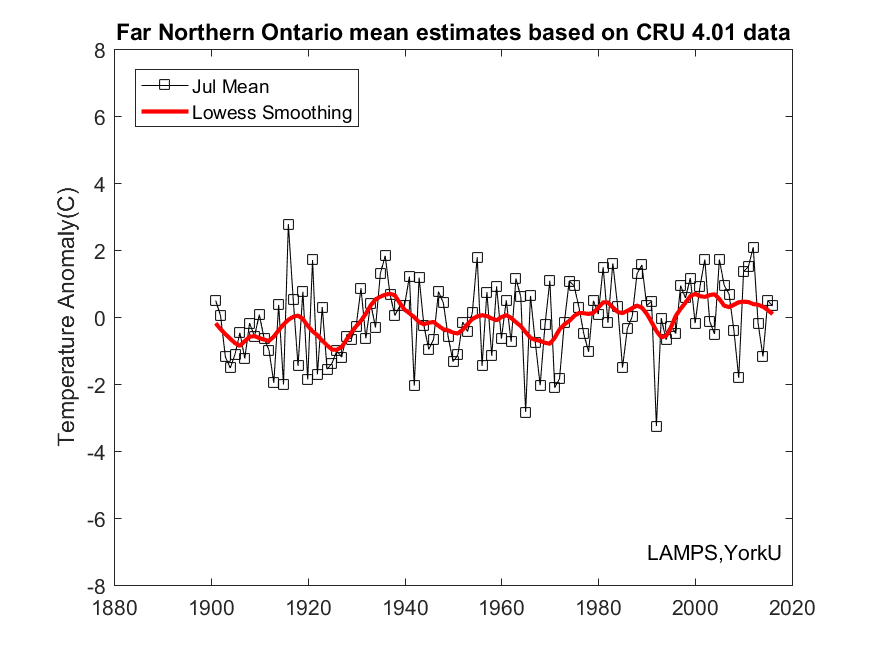
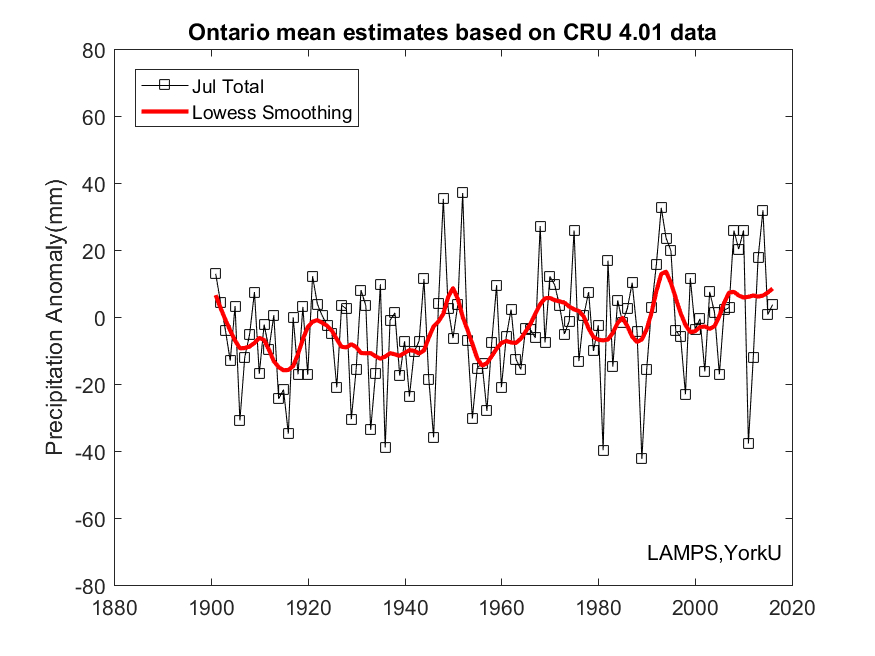
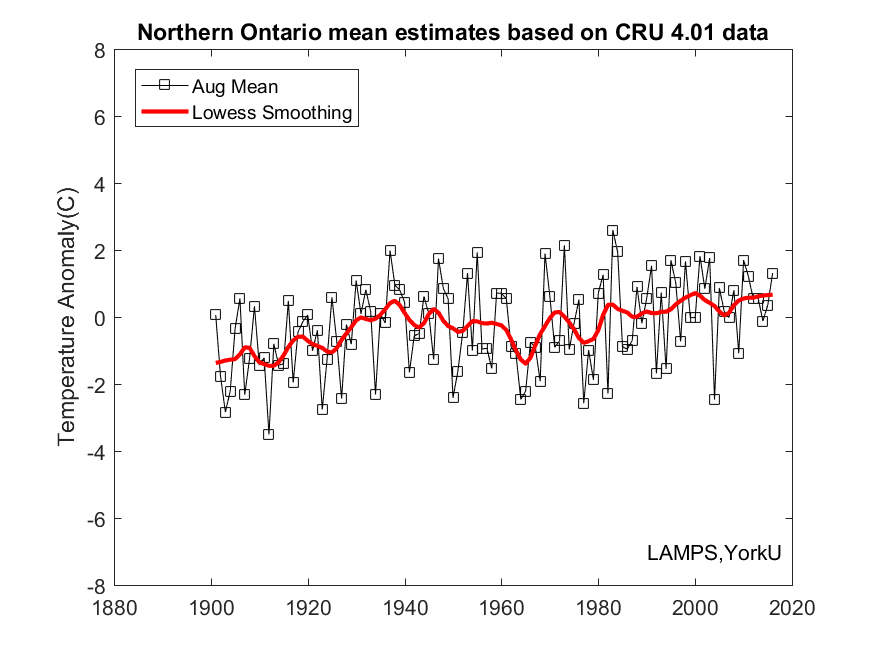
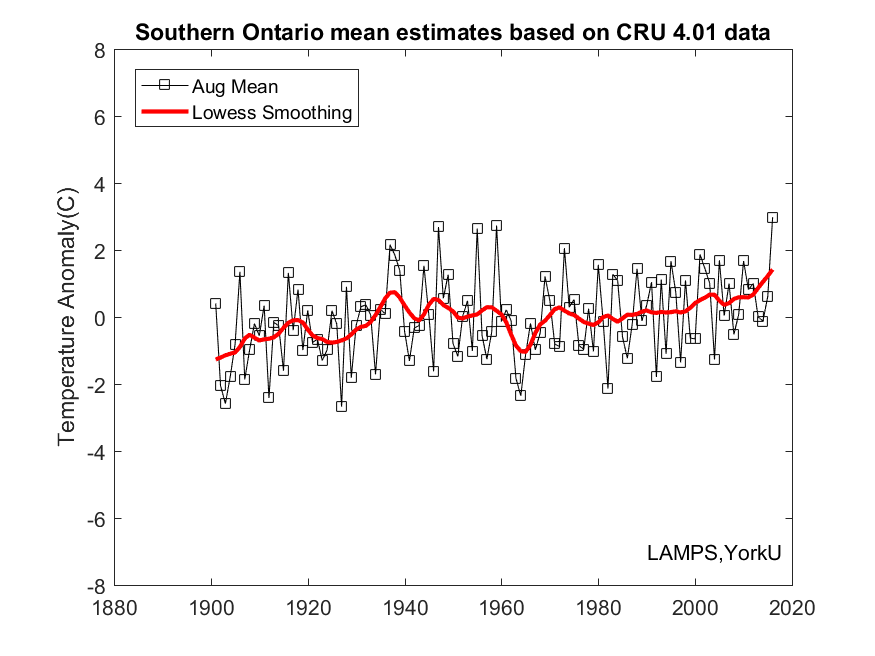
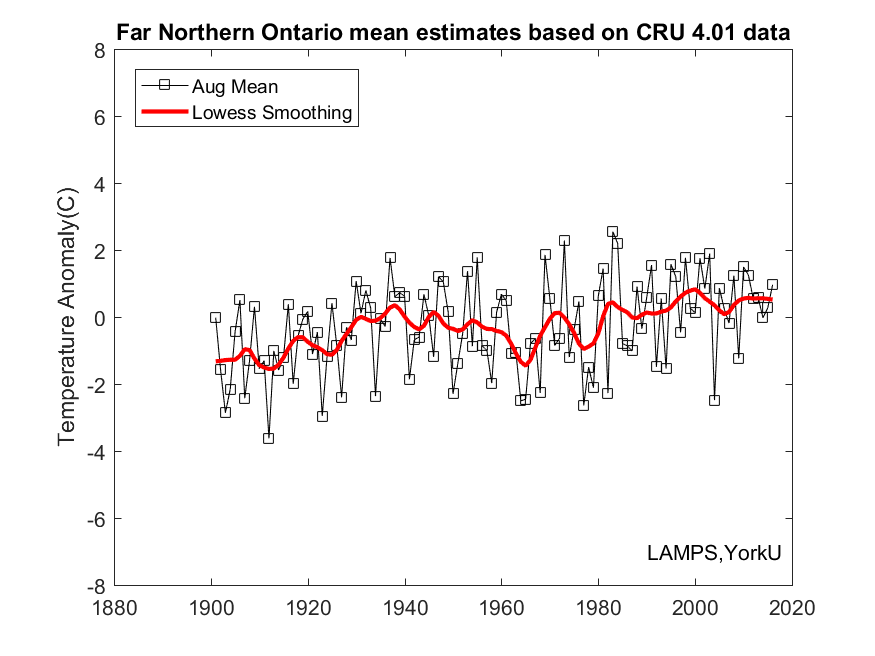
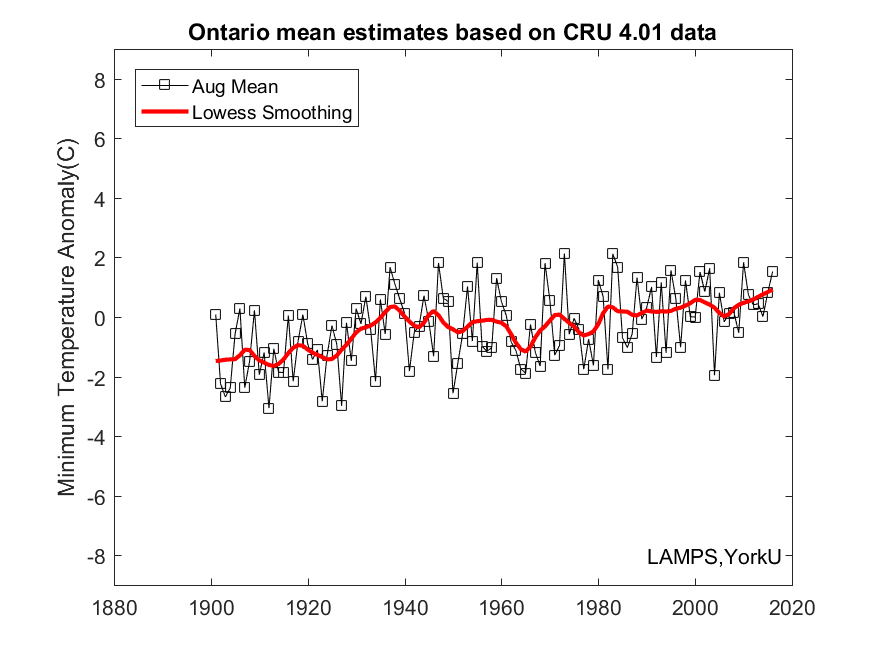
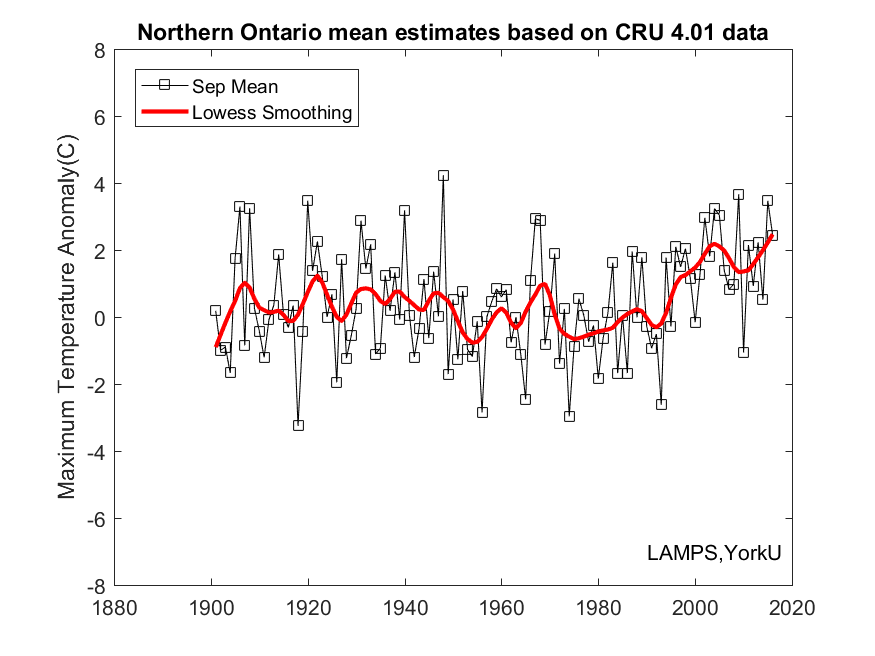
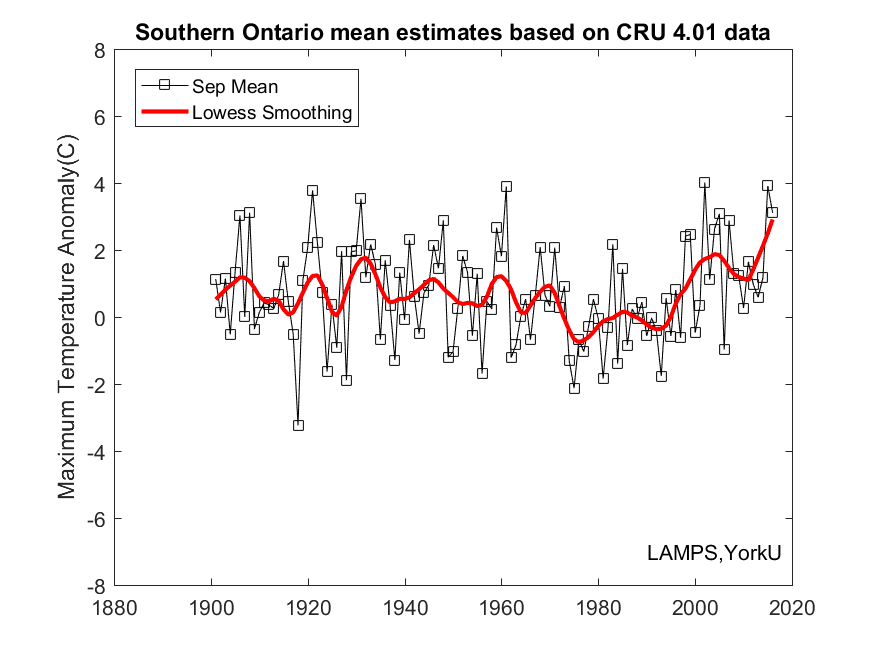
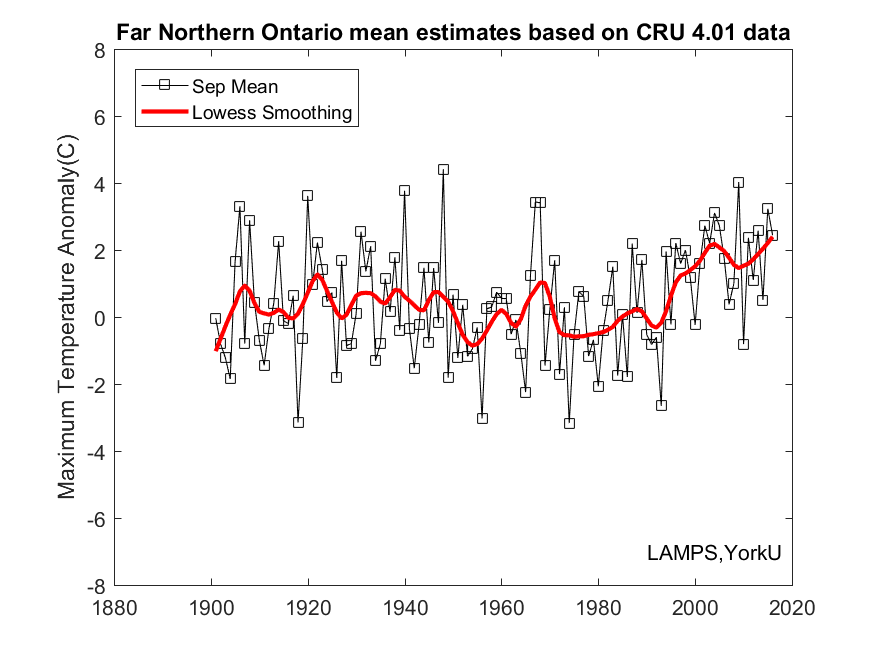
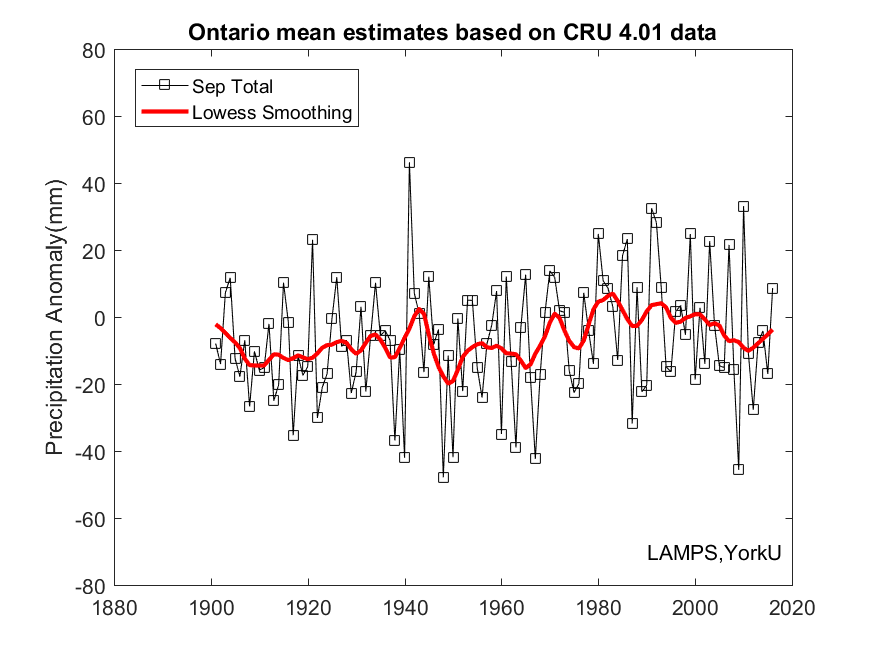
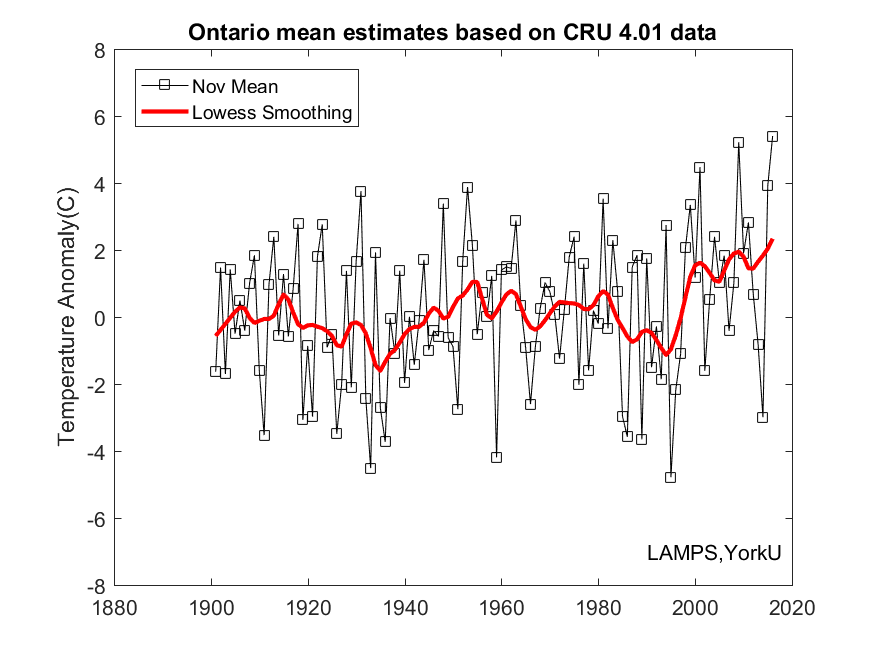
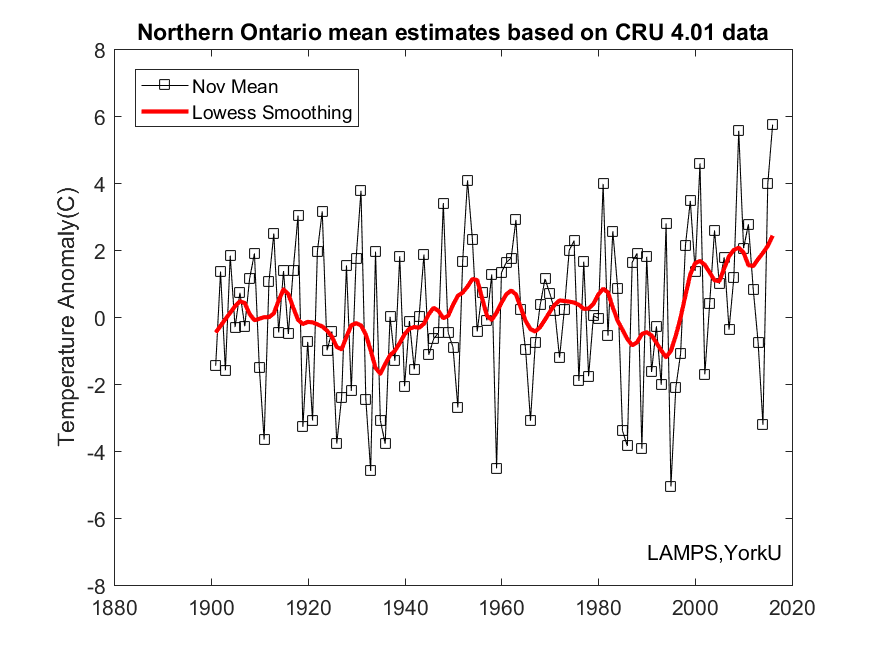
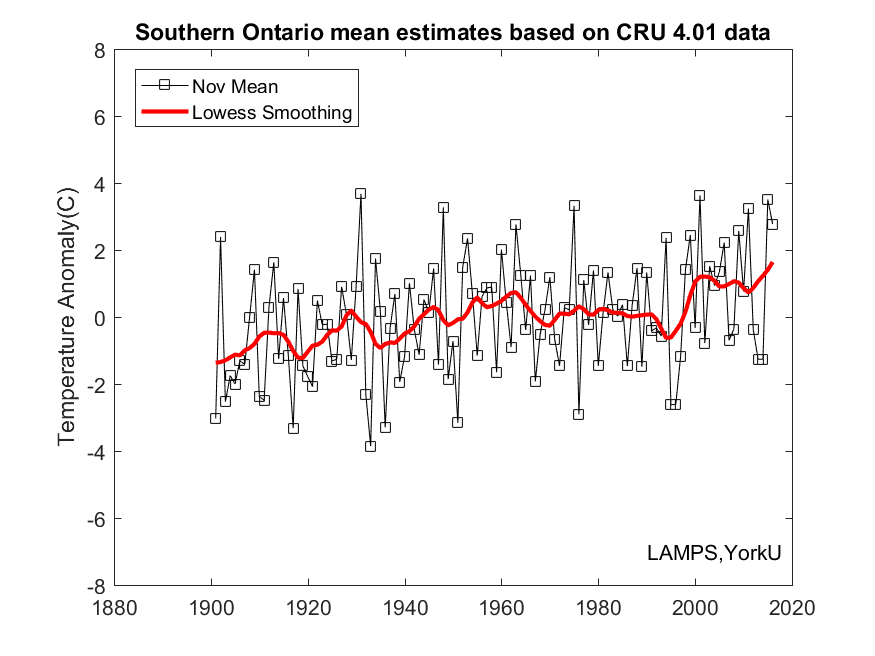
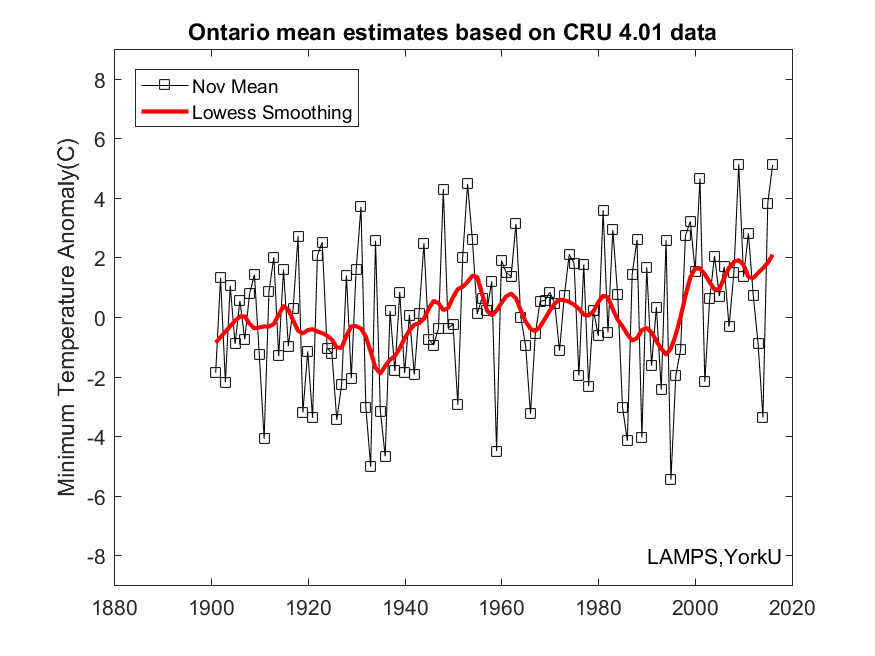
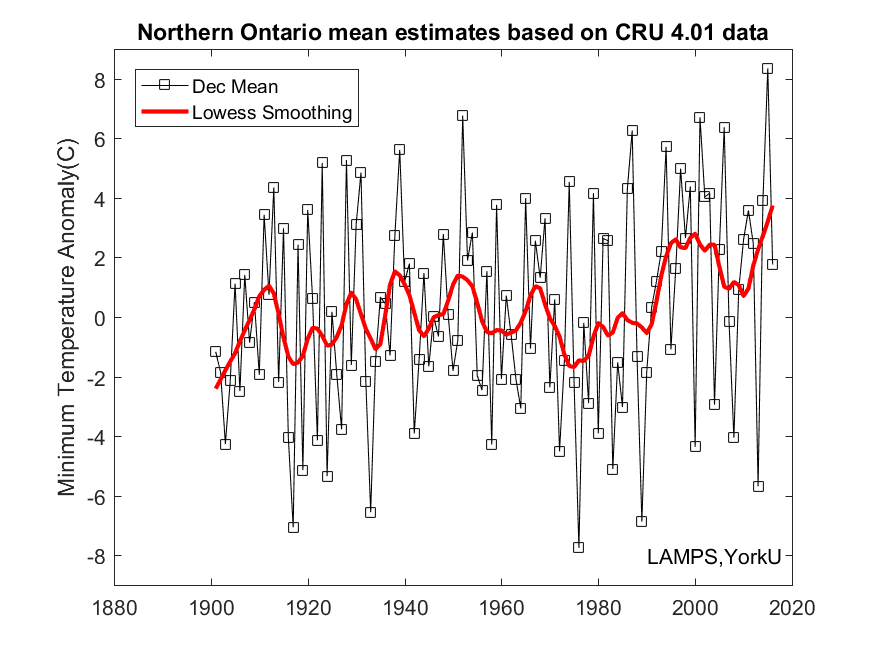
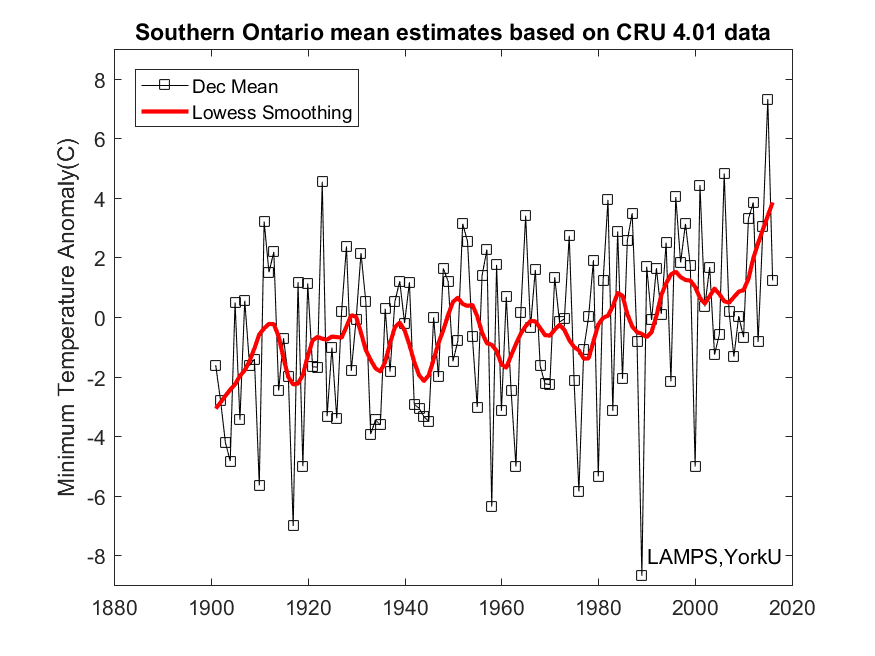
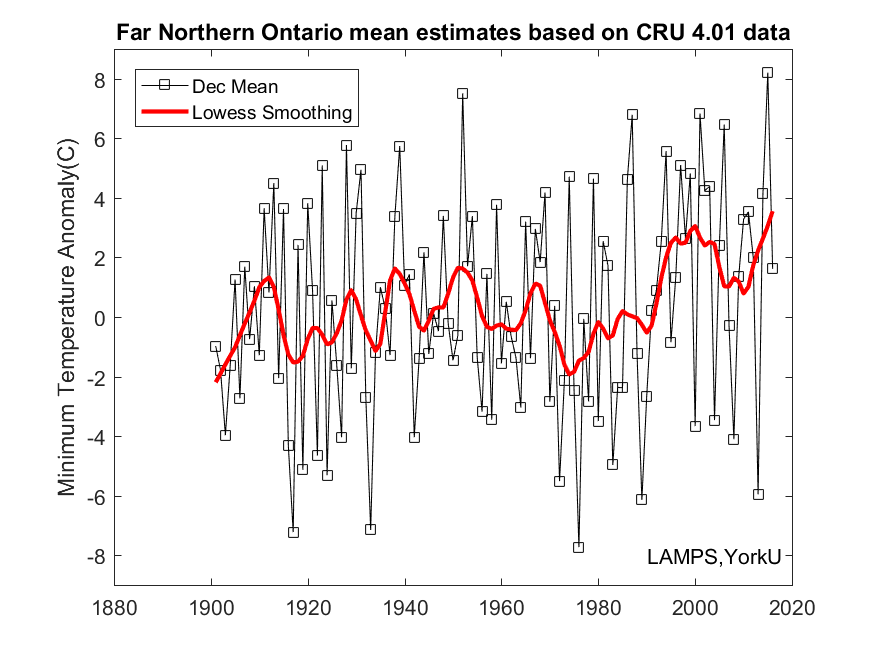
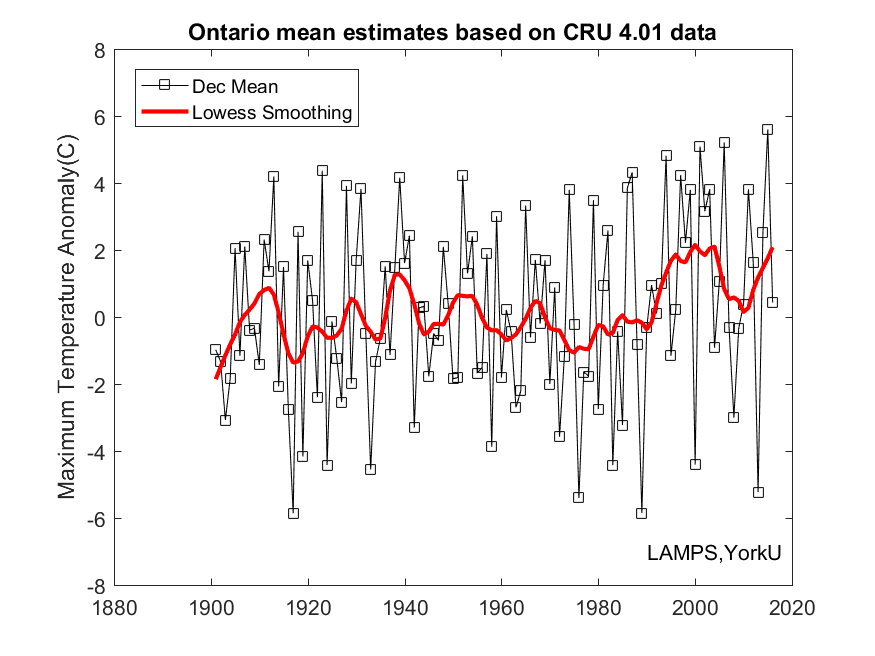
Where Year 2016 Stands in Ontario’s Changing Climate?
Historical climate change based on CRU 4.01 data (released in Sep. 2017)
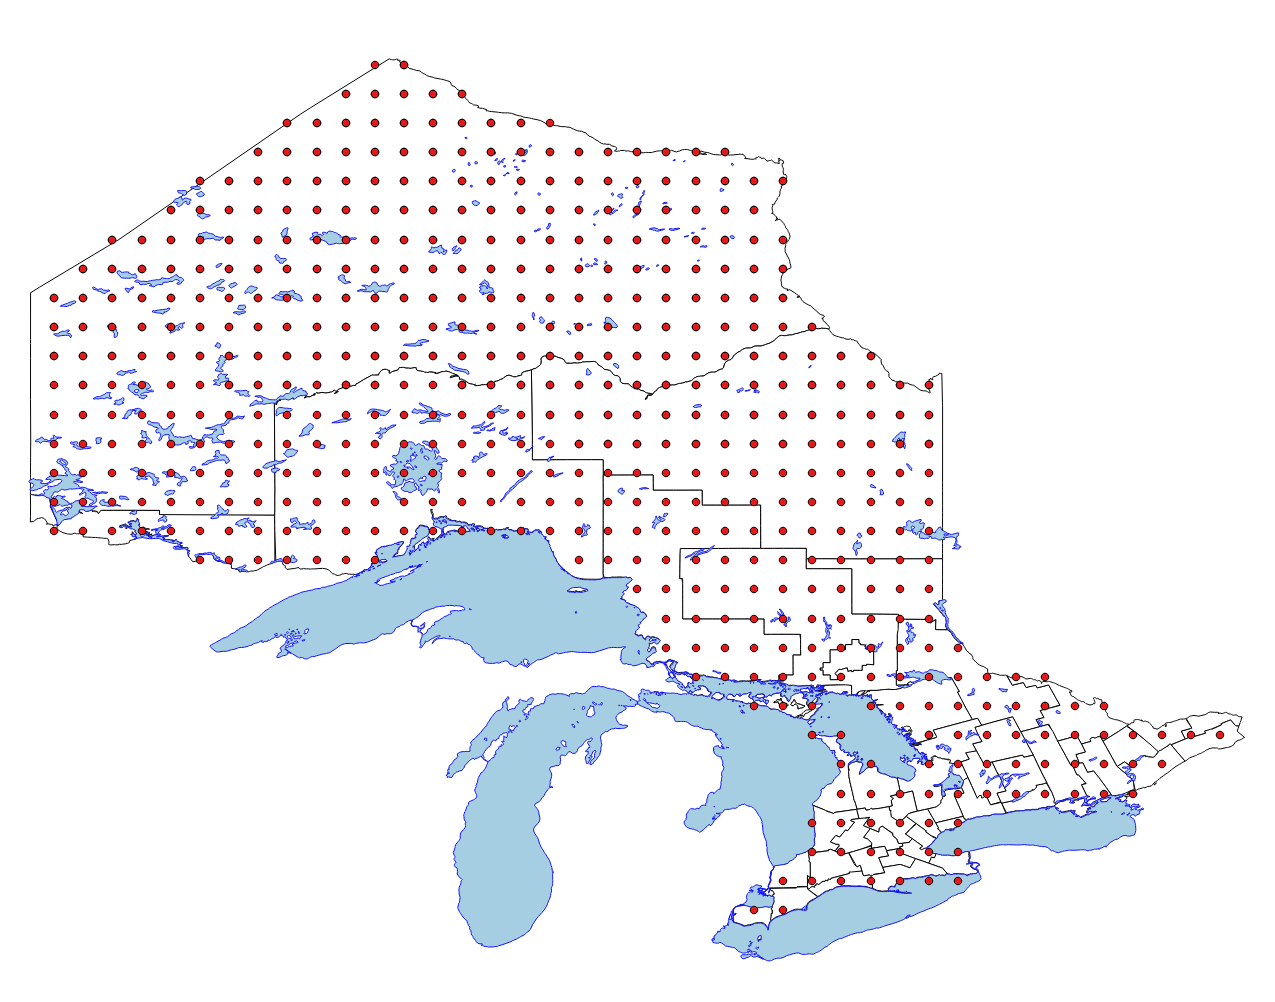
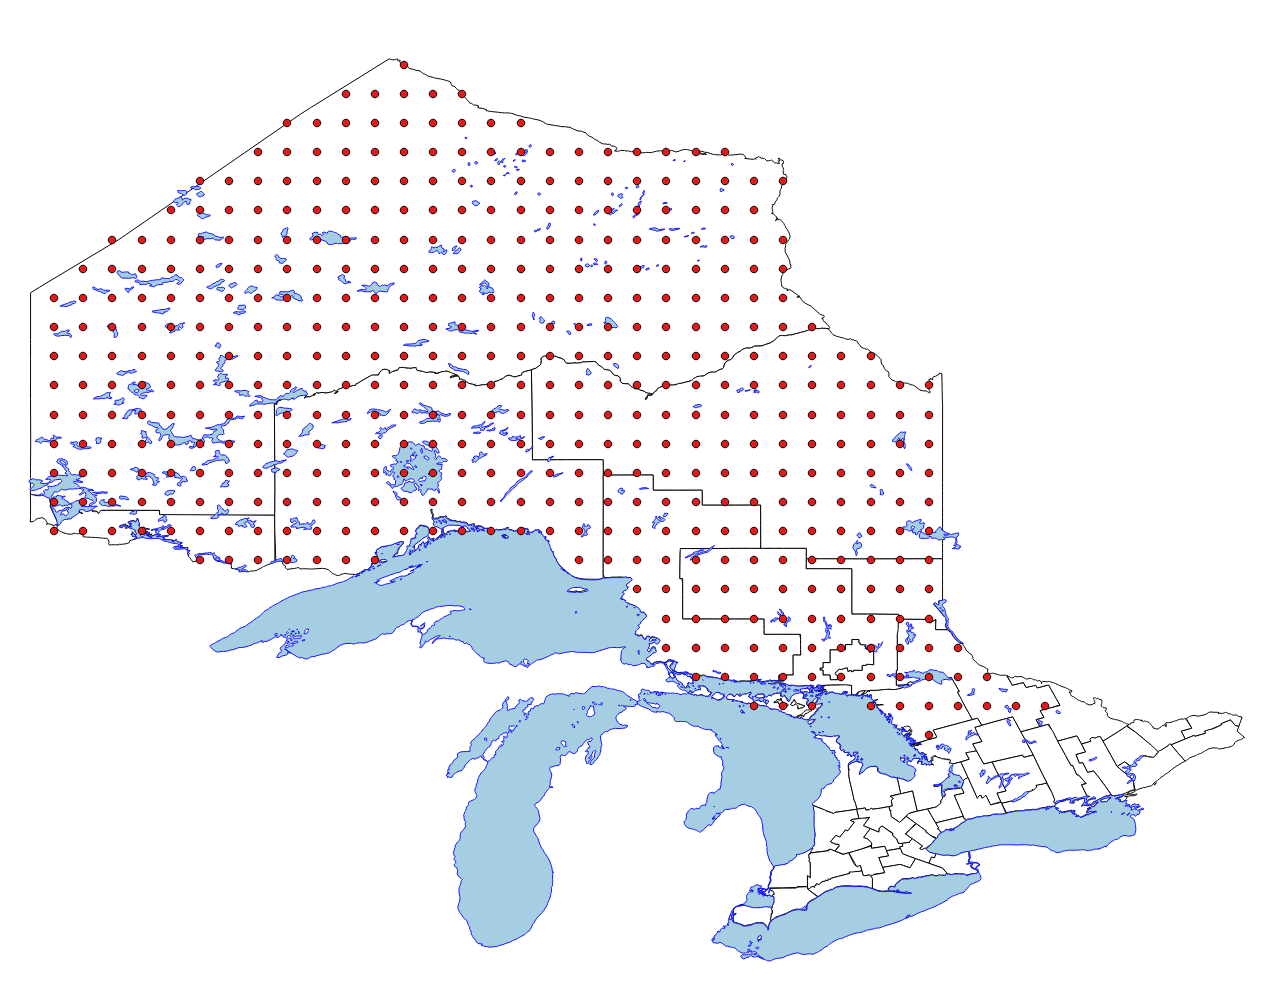
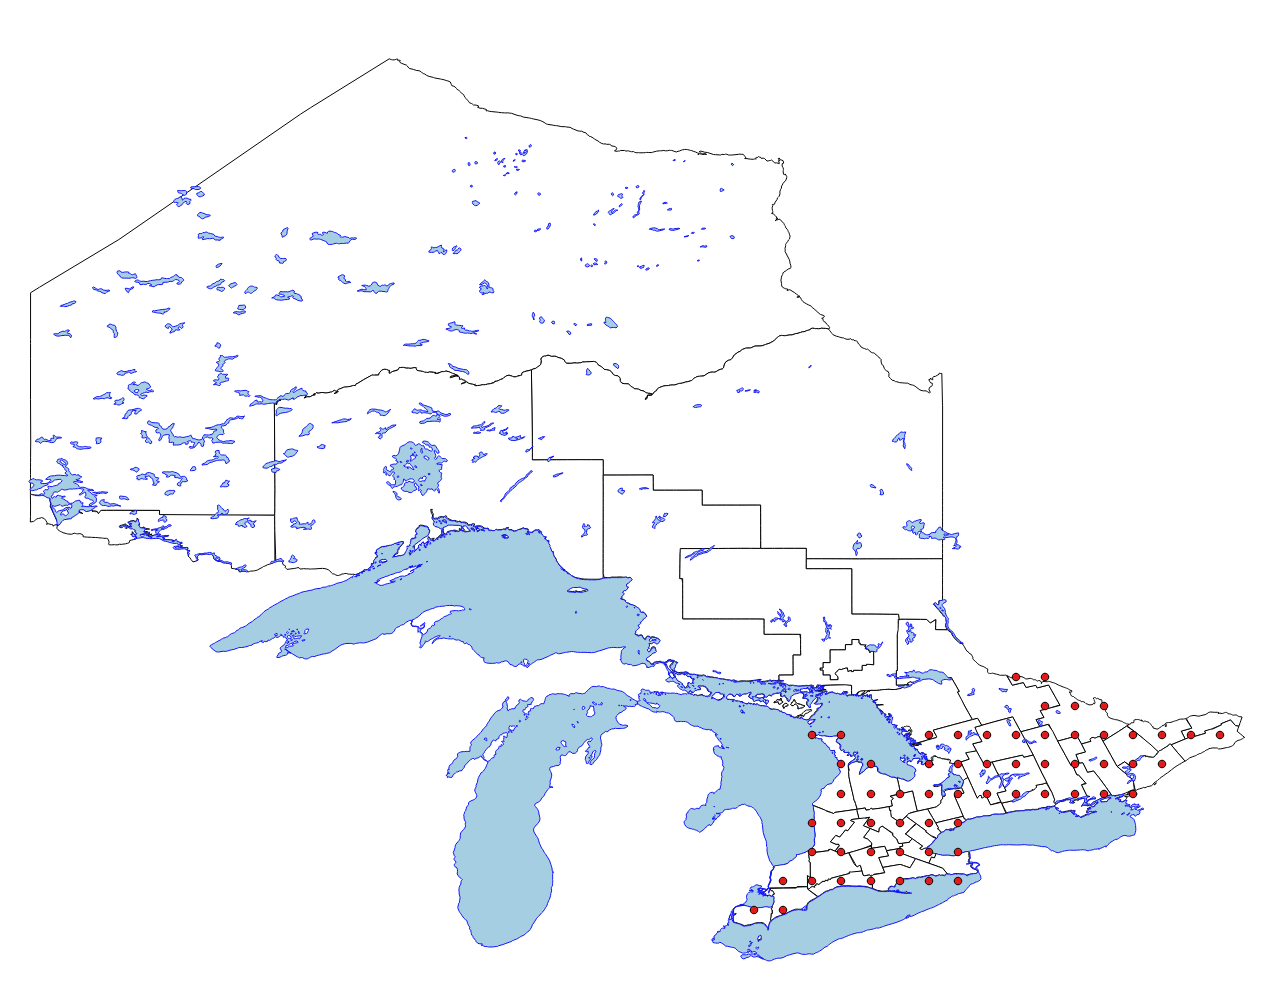
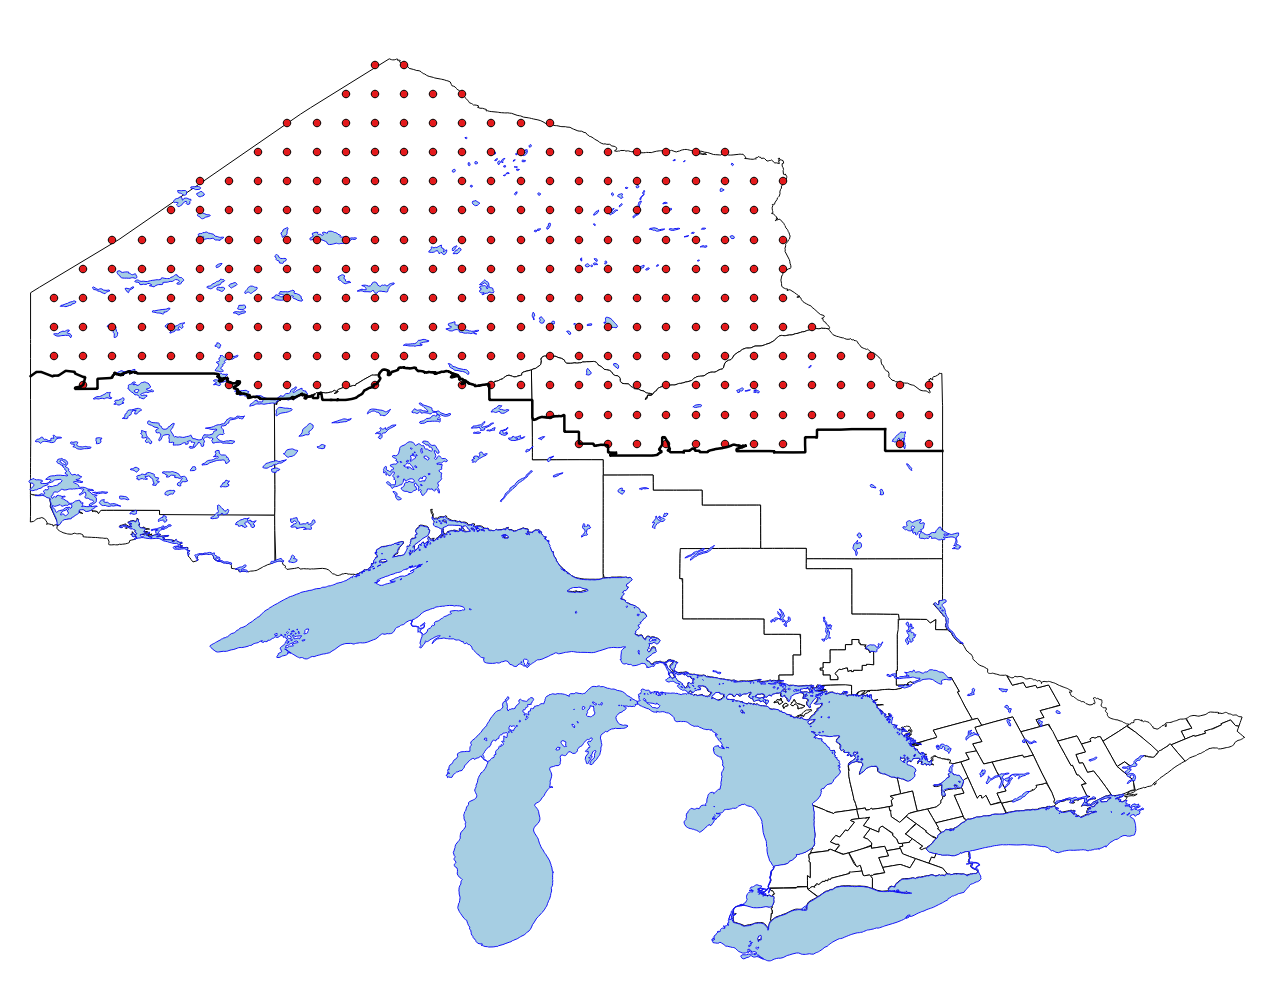
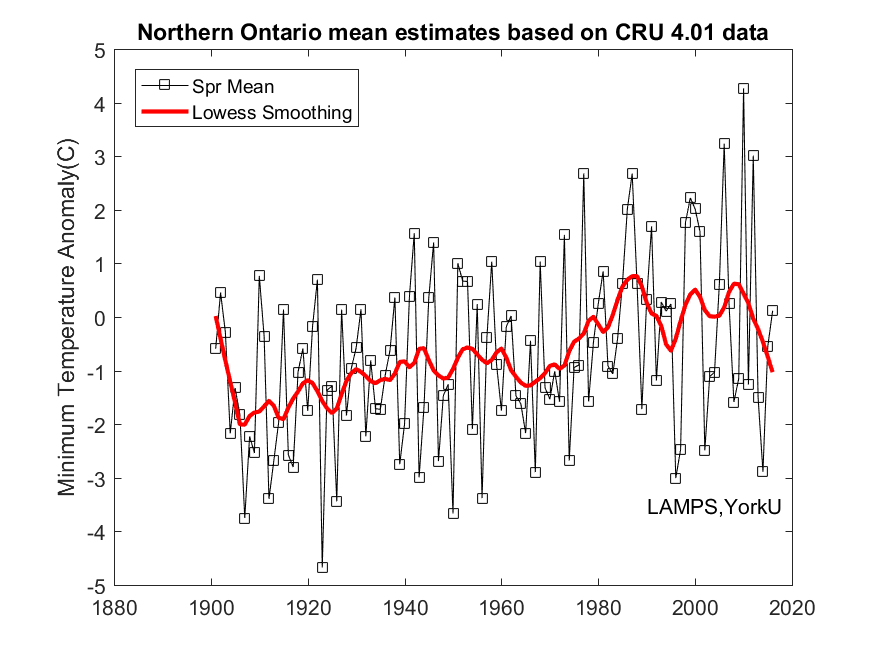
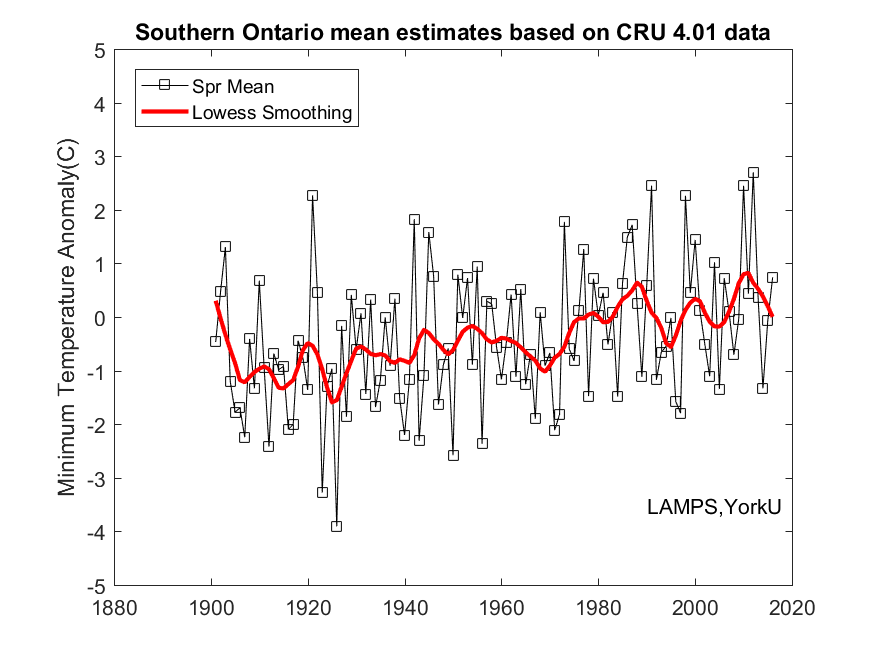
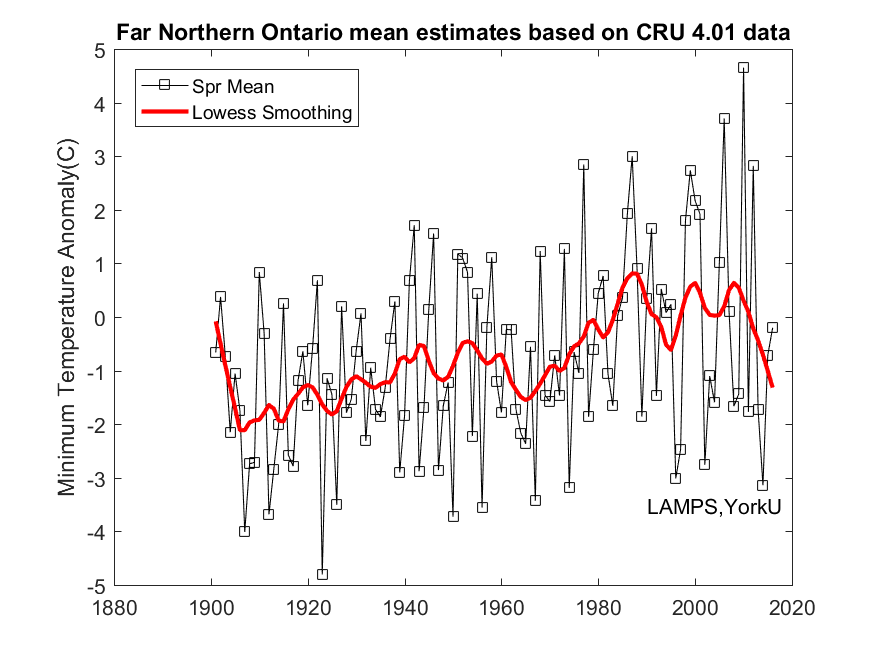
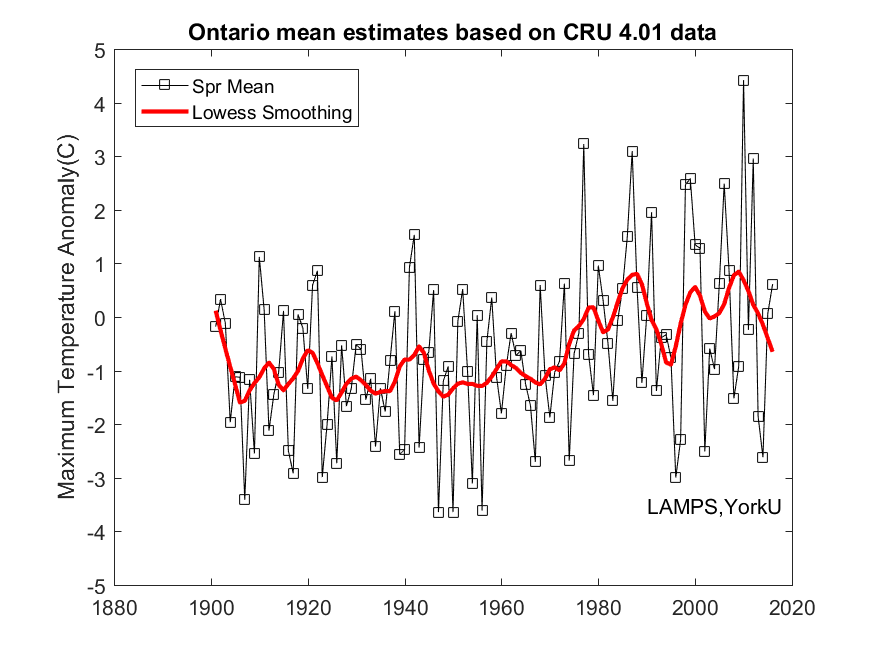
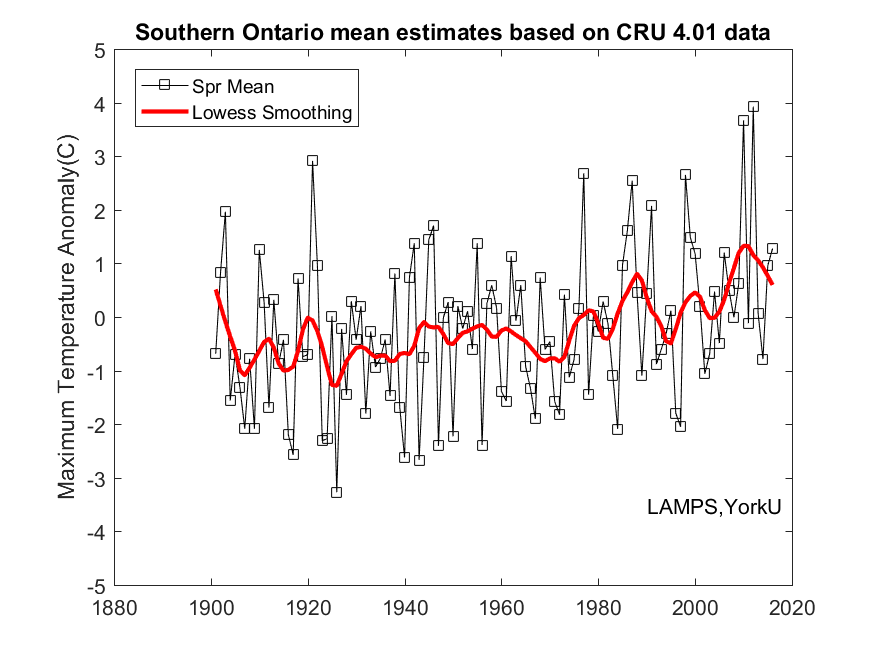
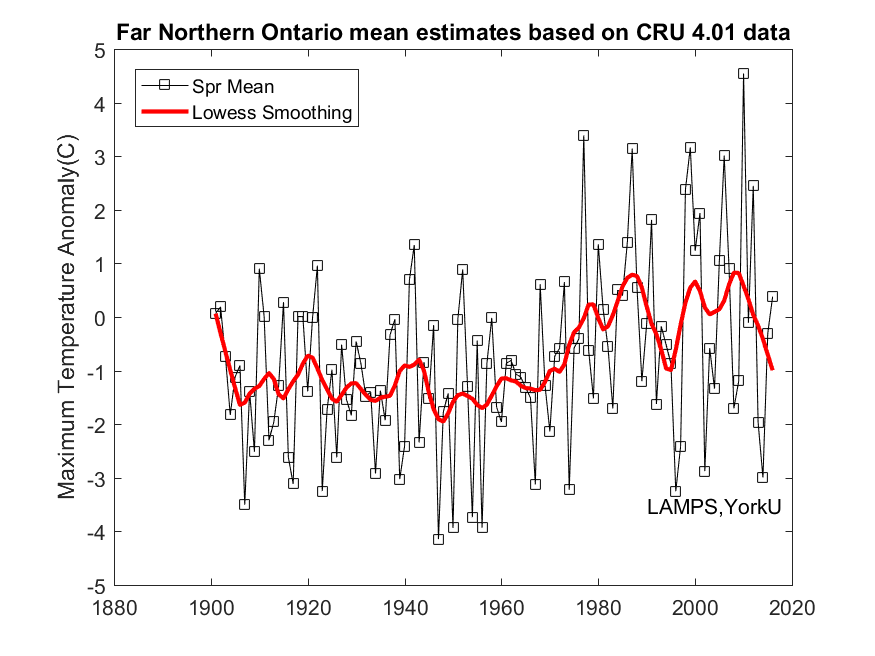
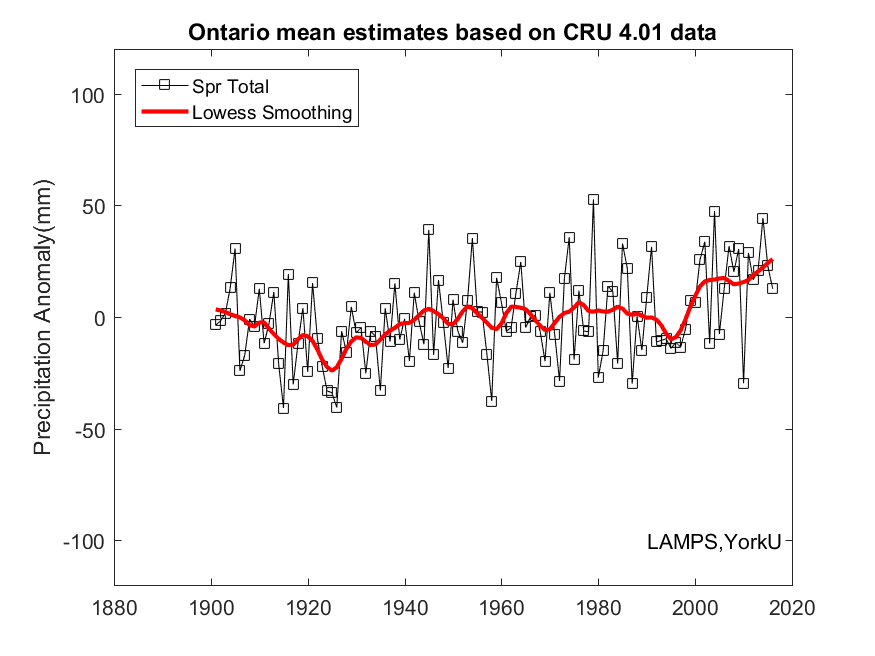
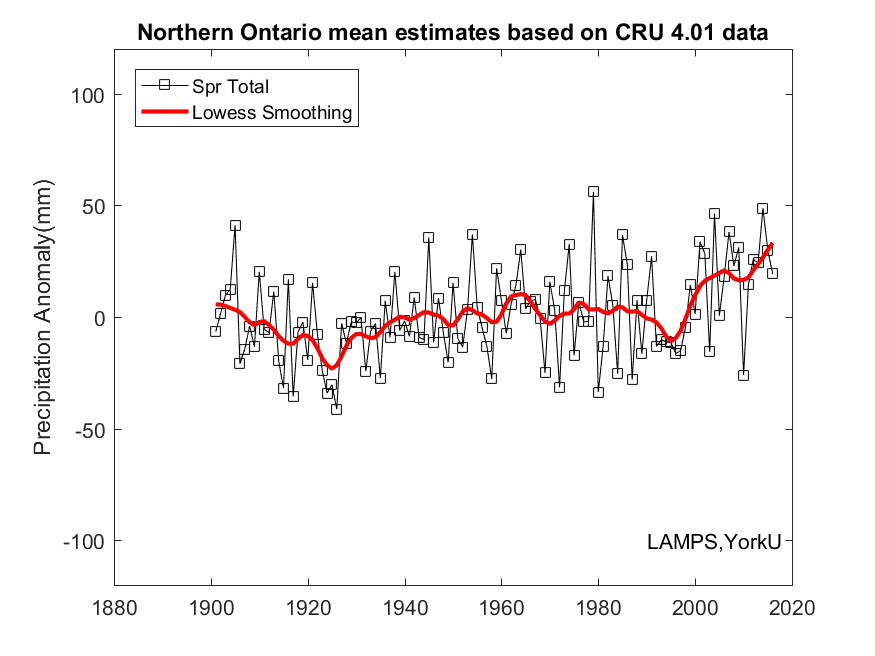
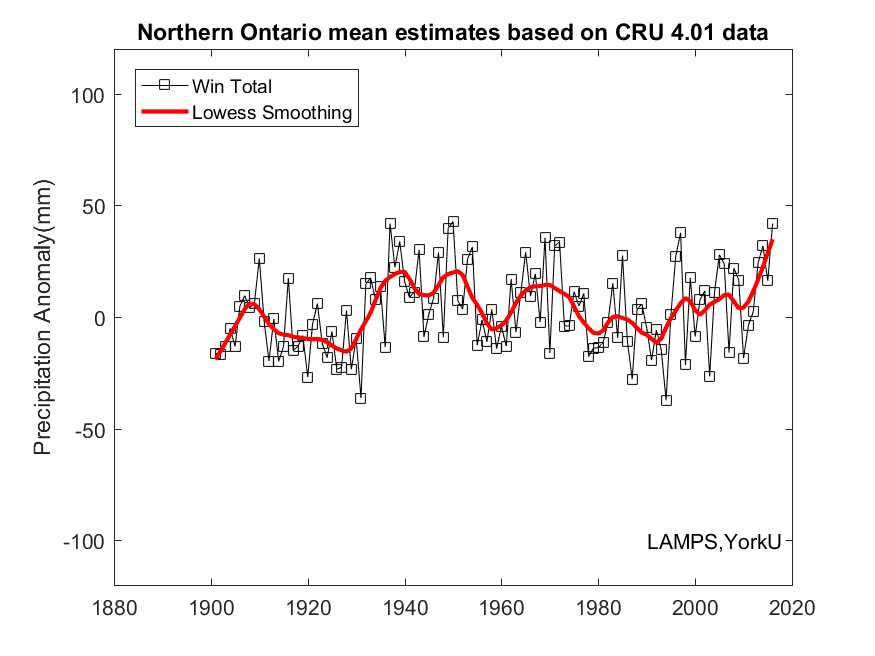
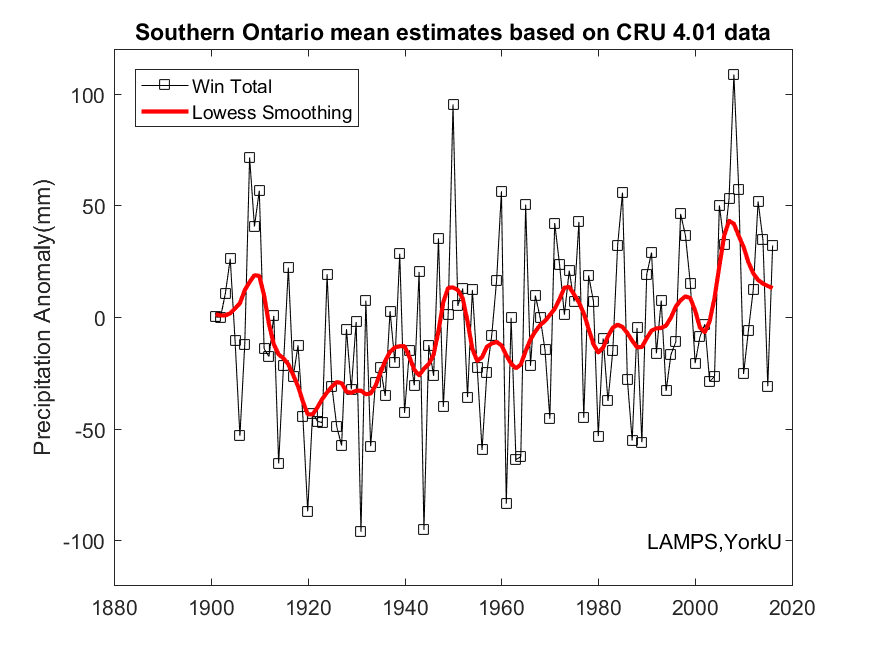
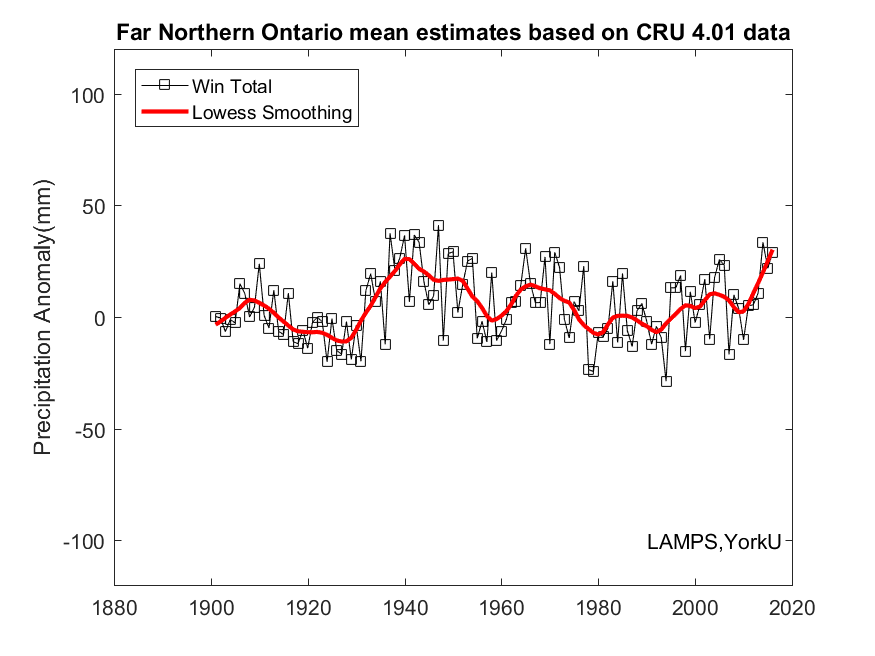
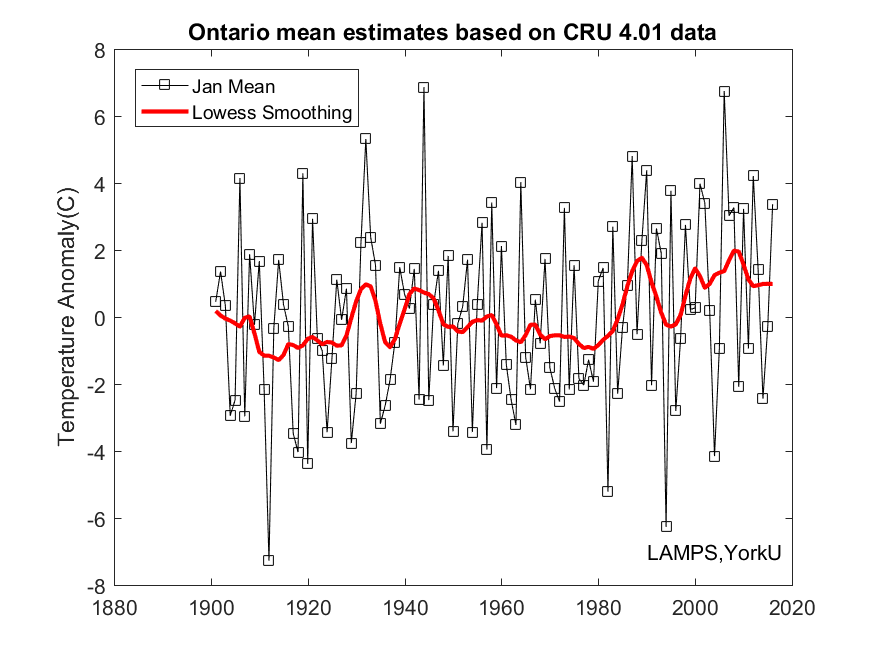
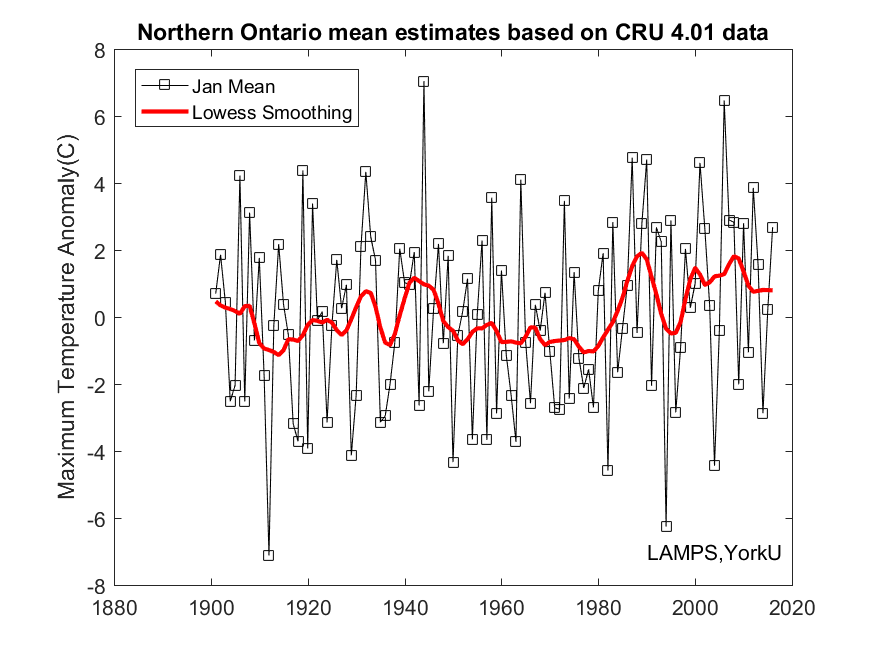
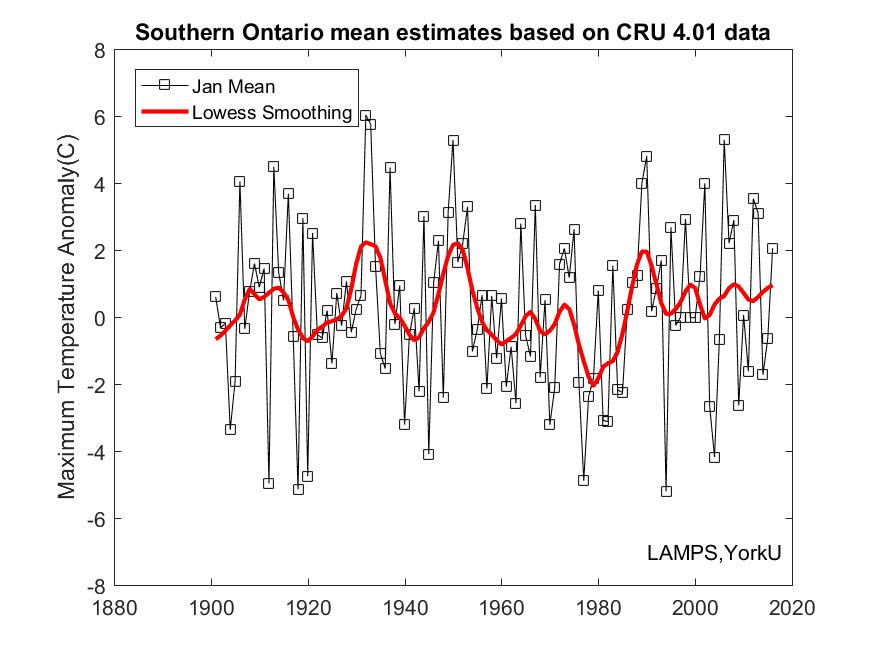
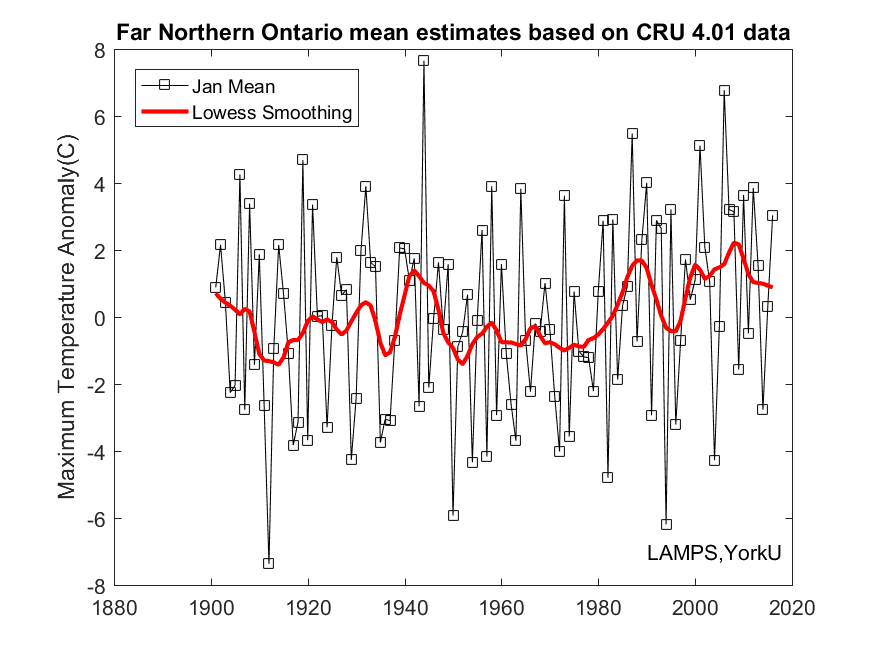
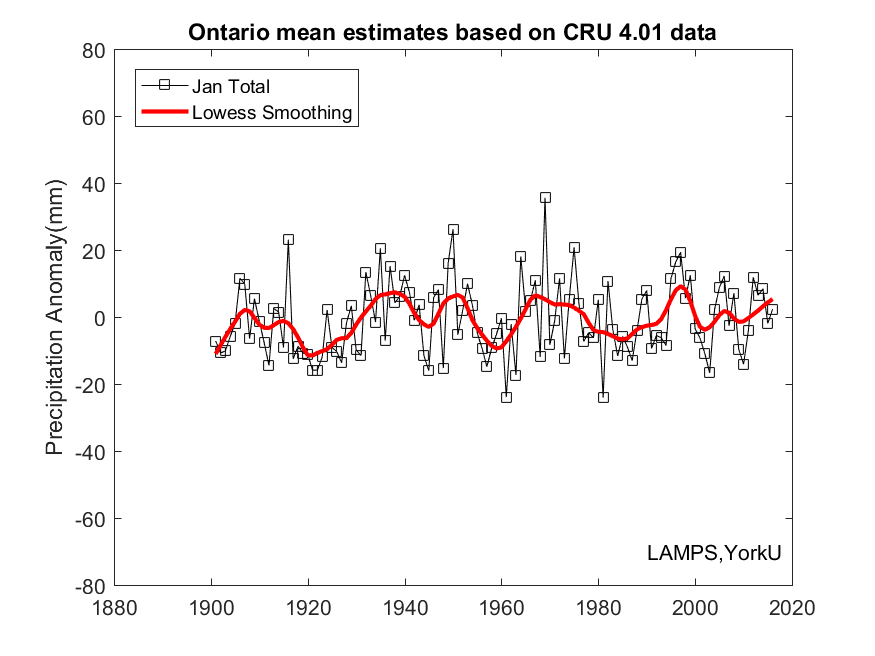
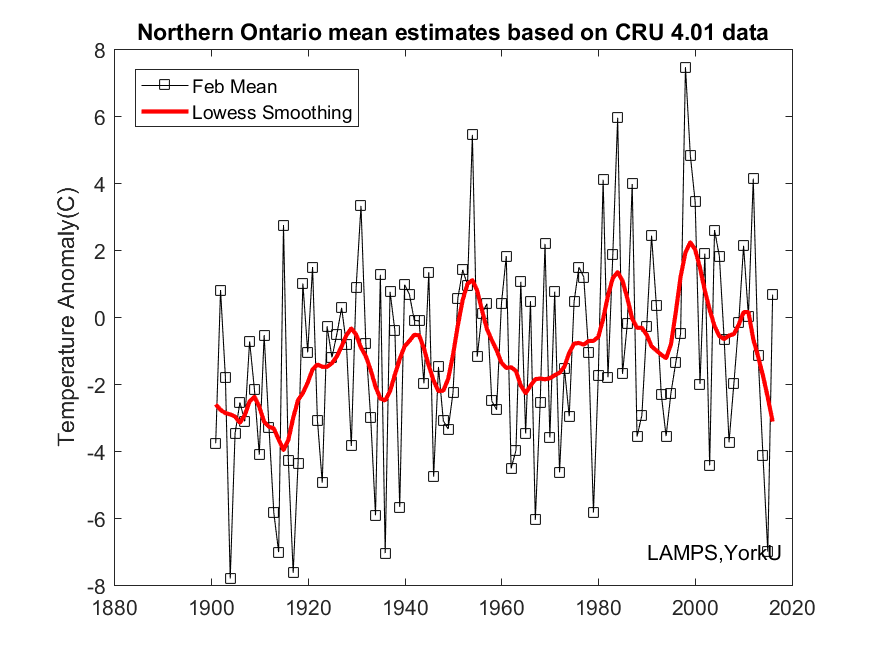
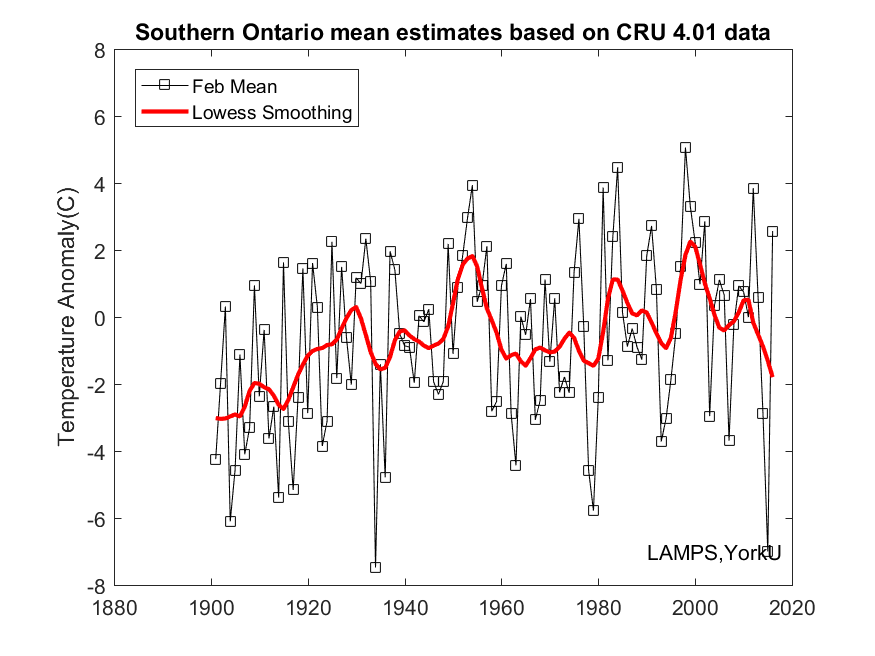
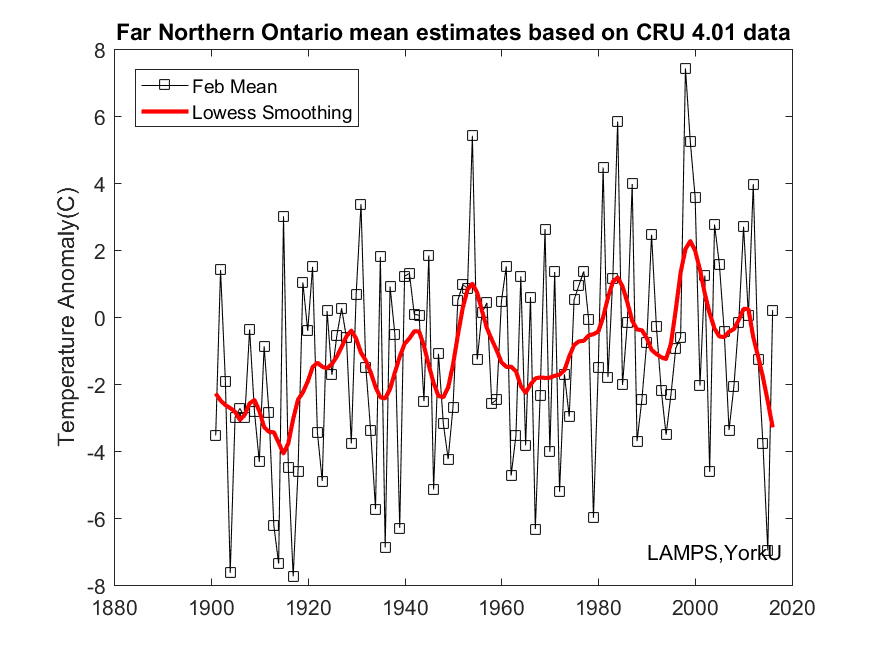
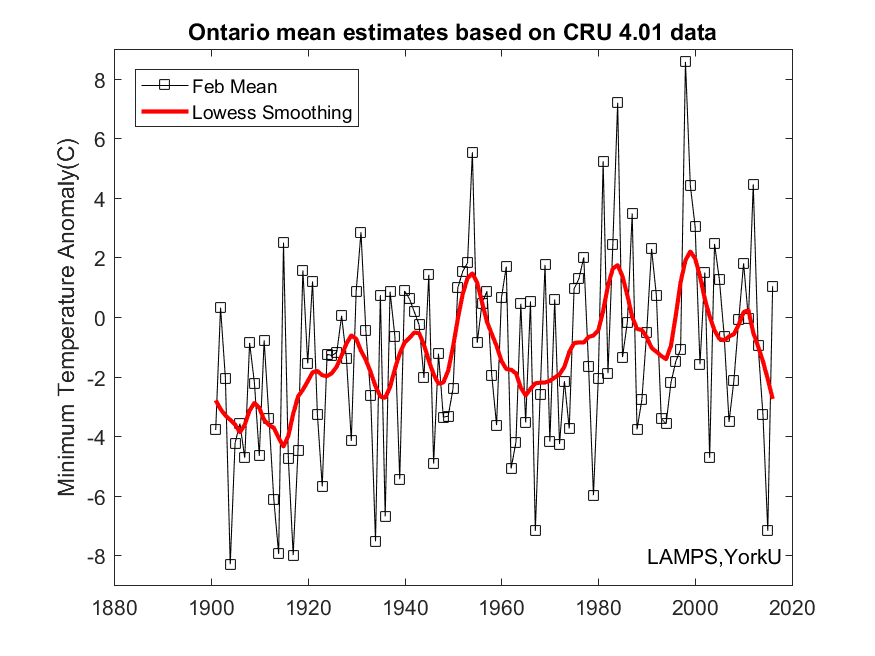
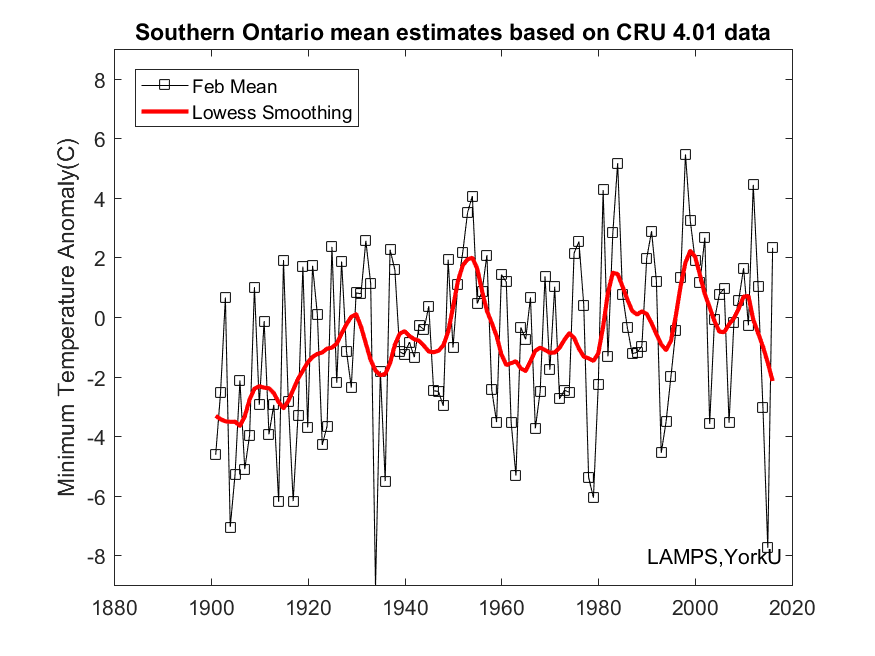
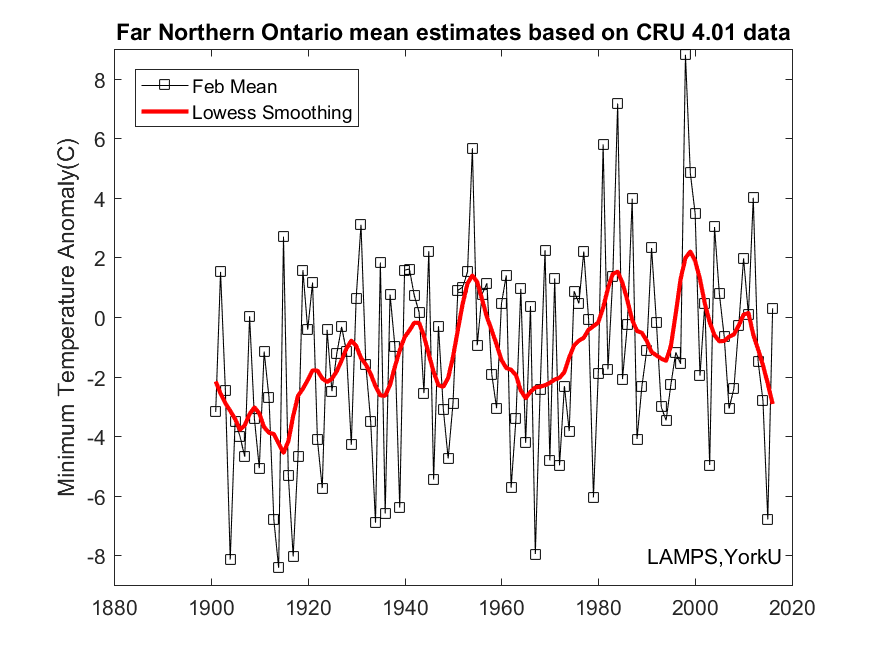
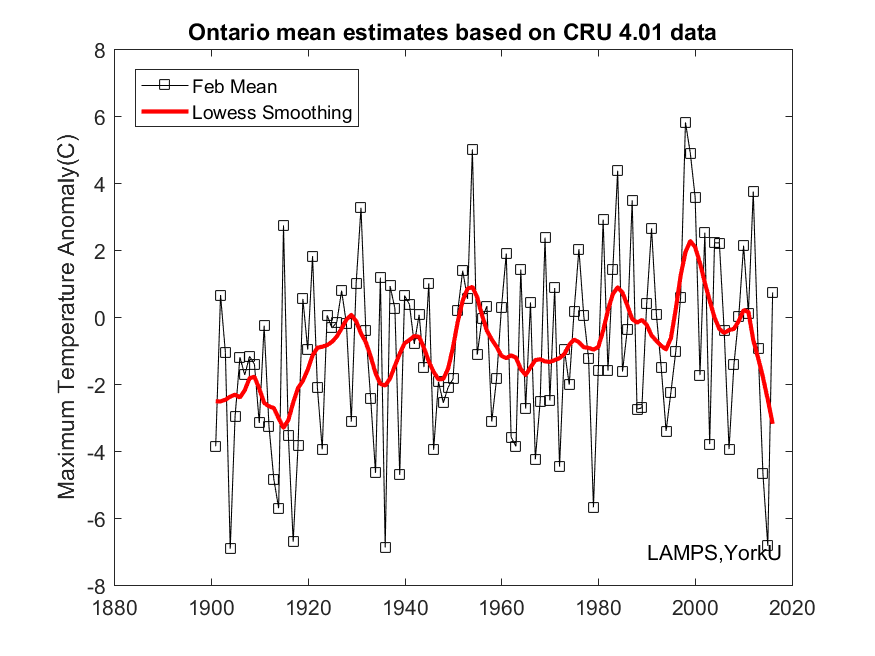
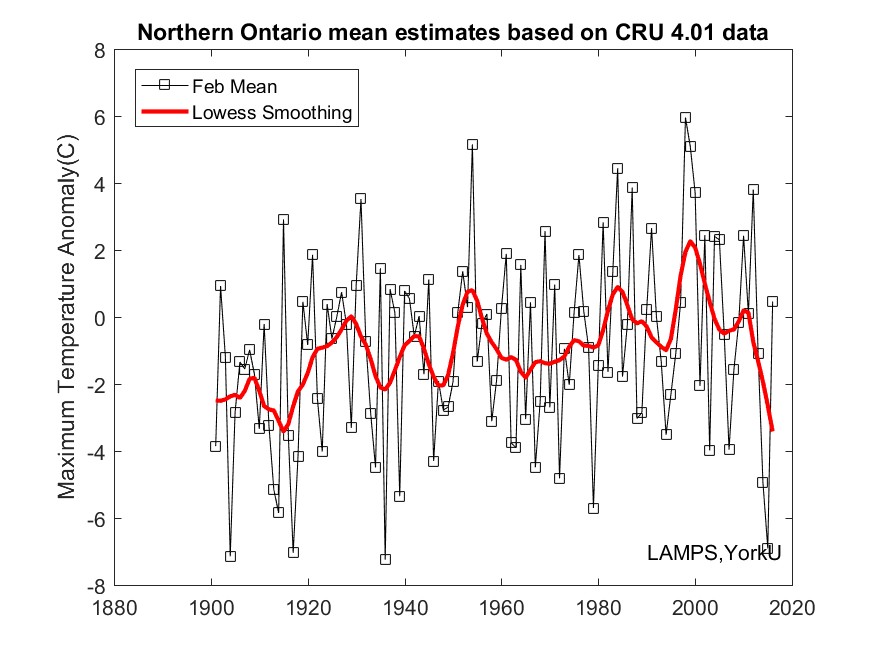
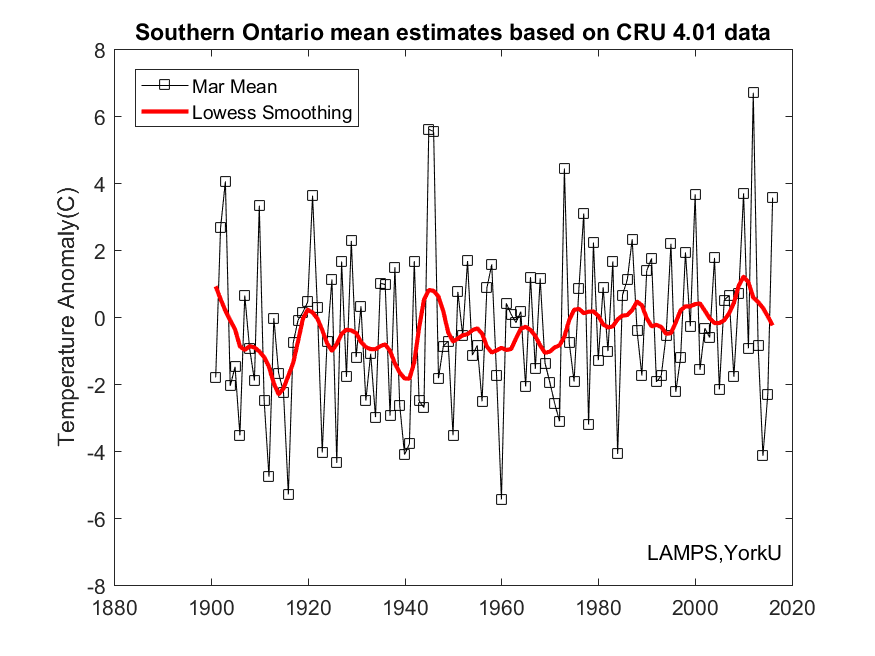
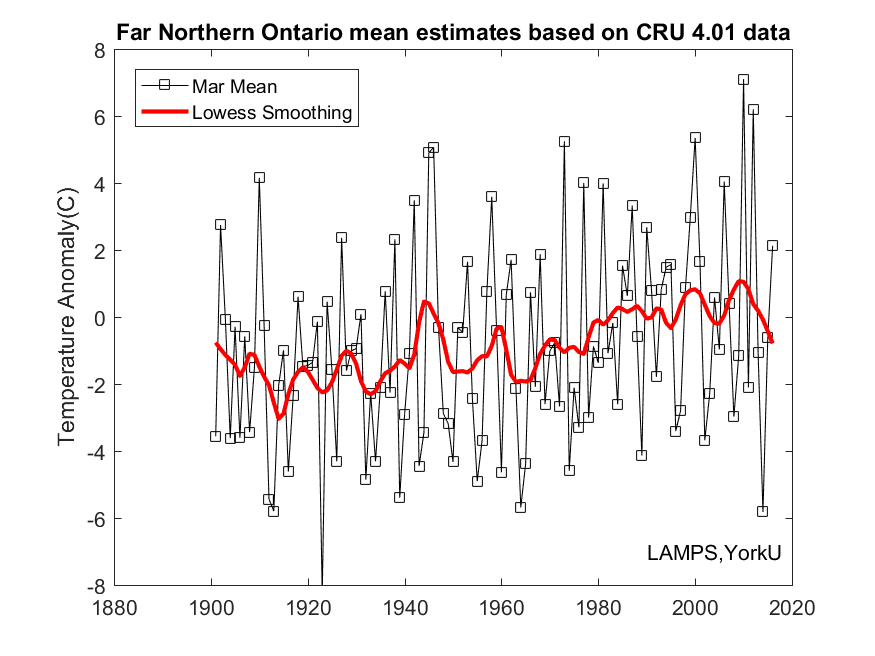
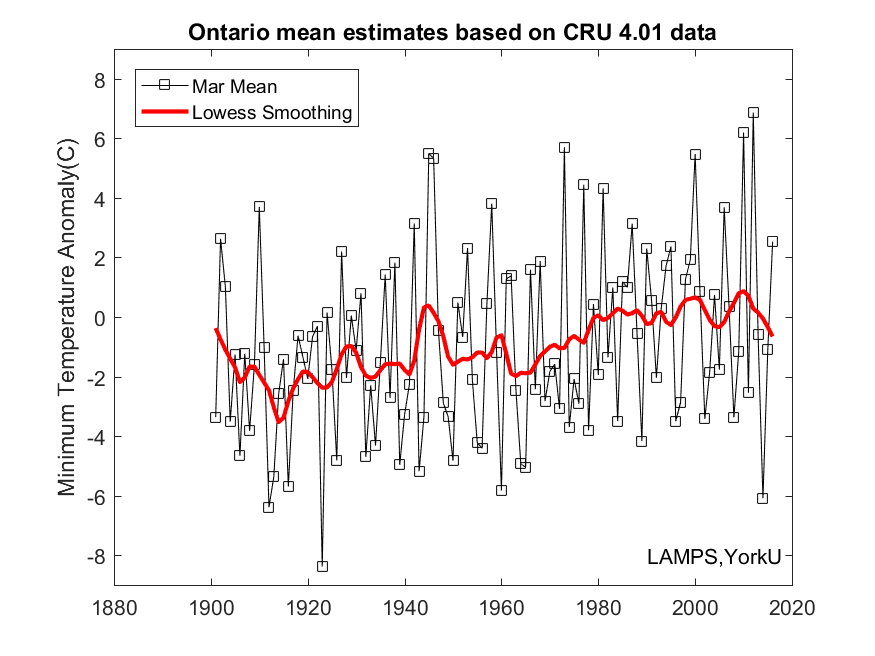
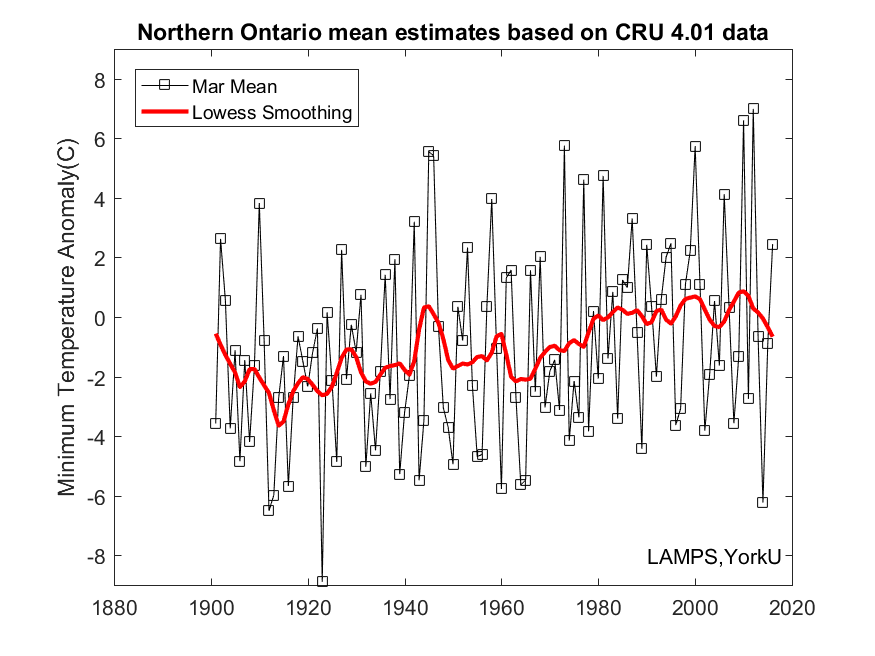
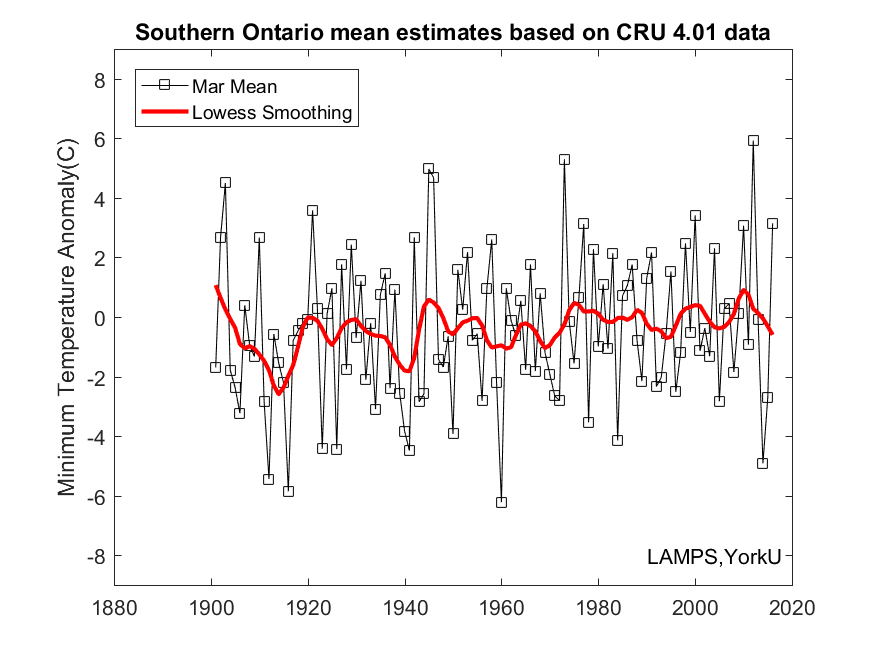
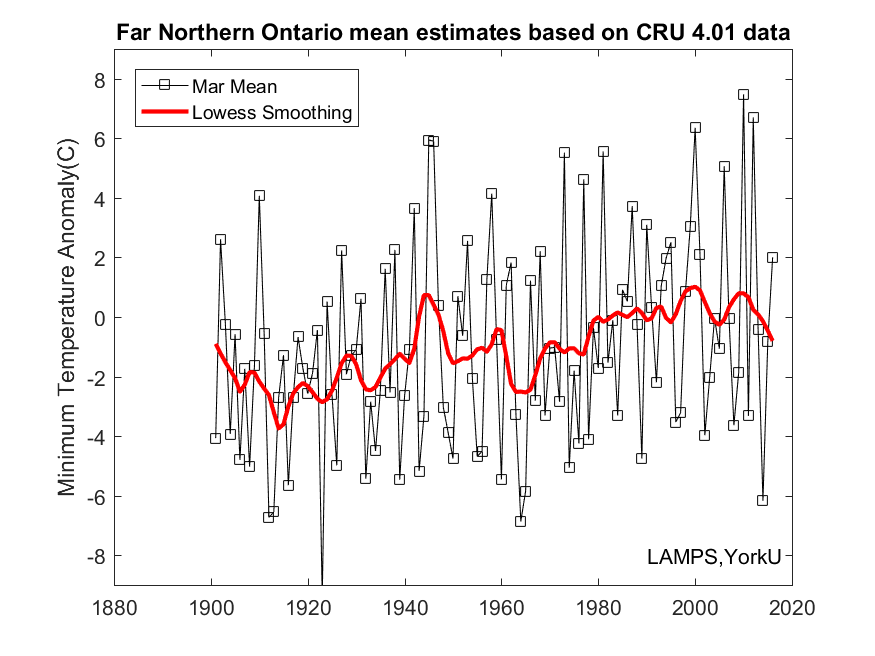
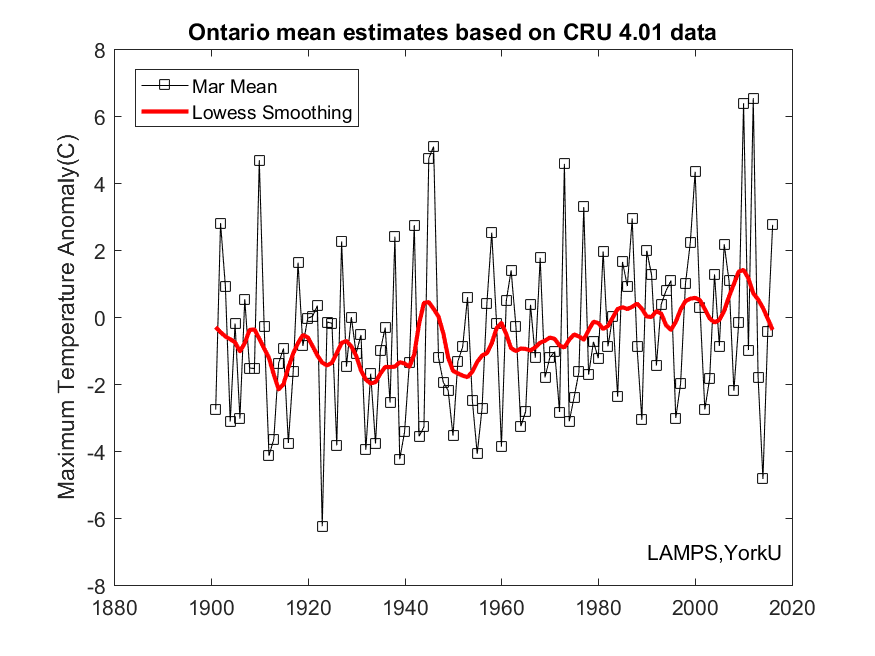
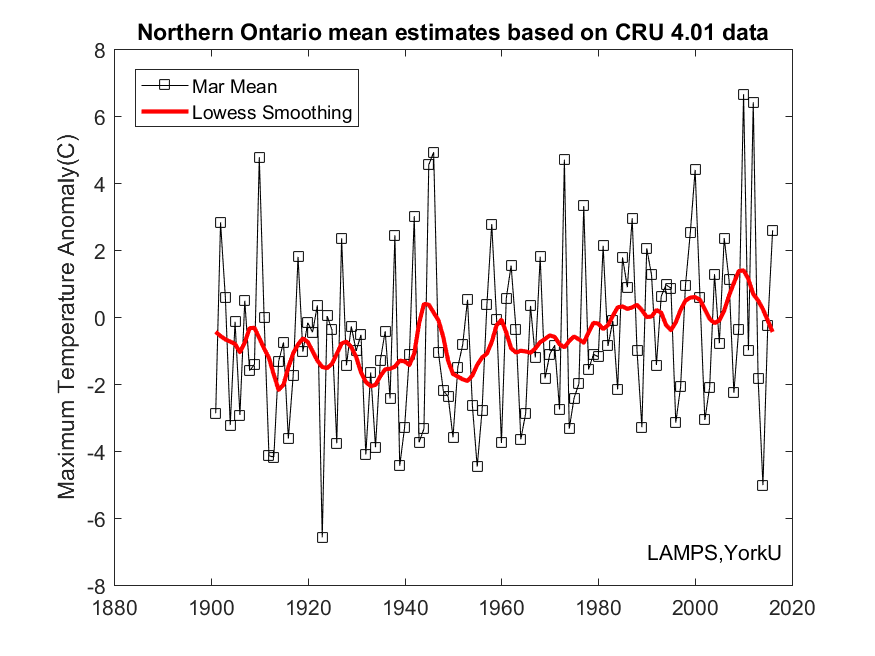
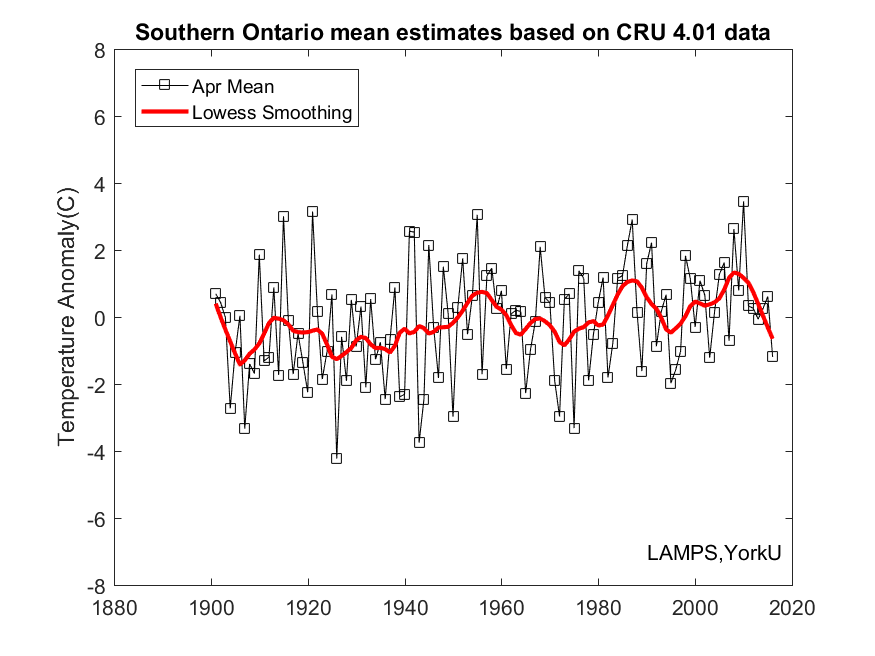
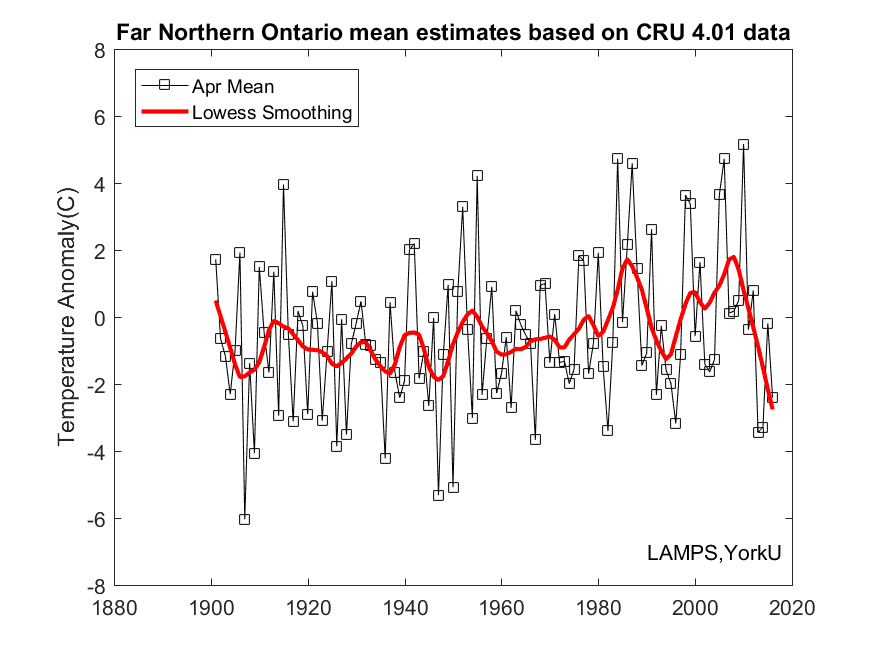
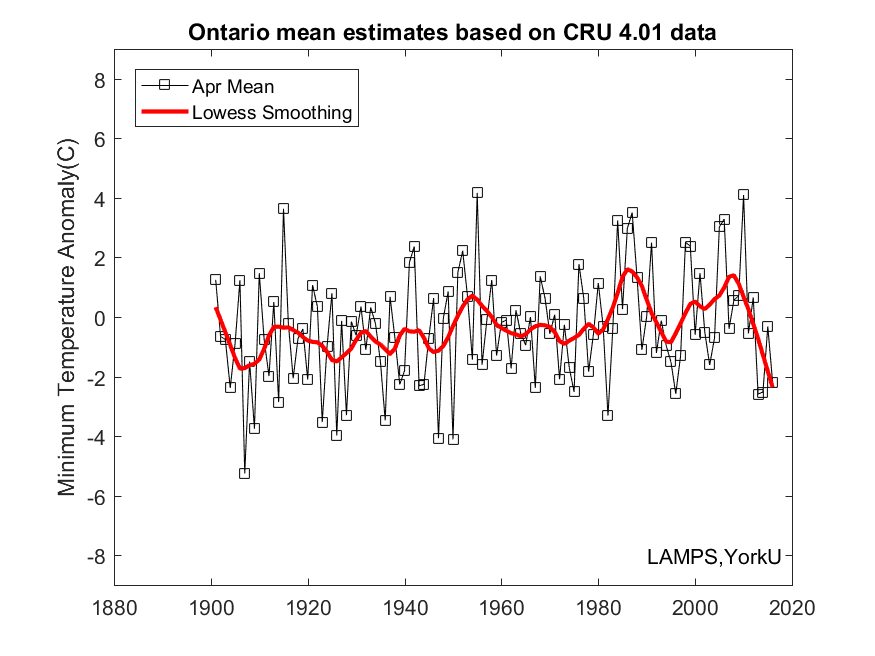
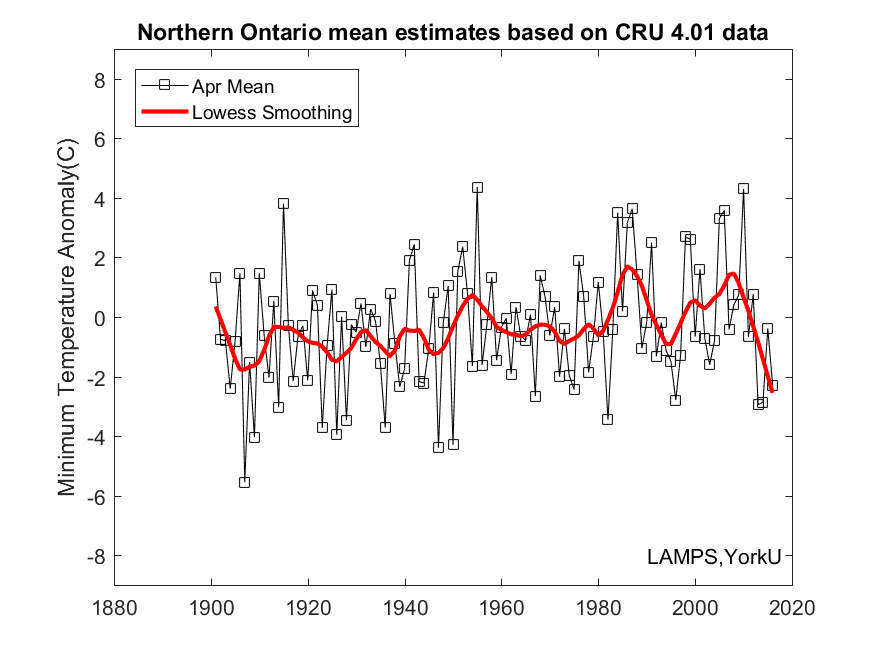
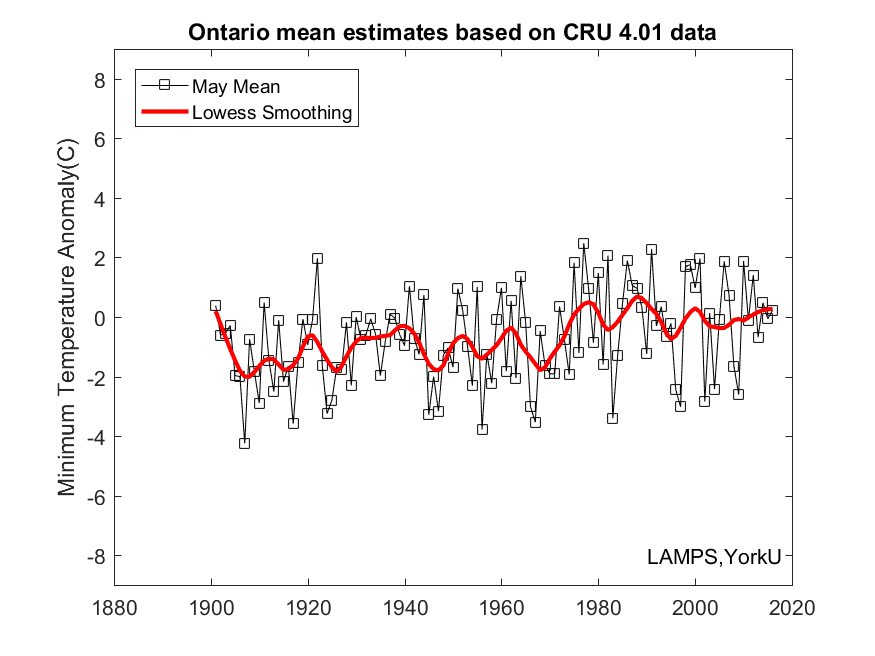
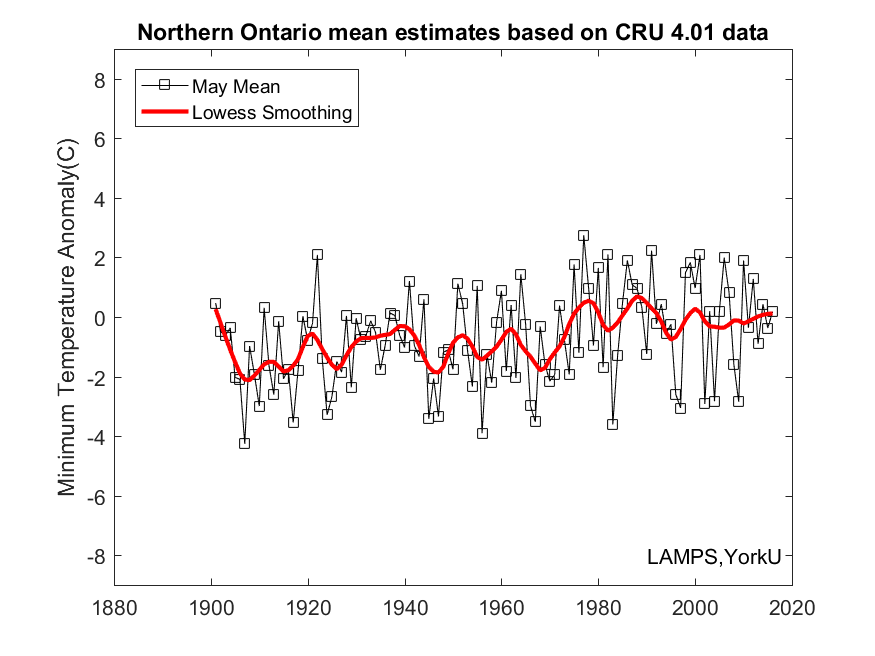
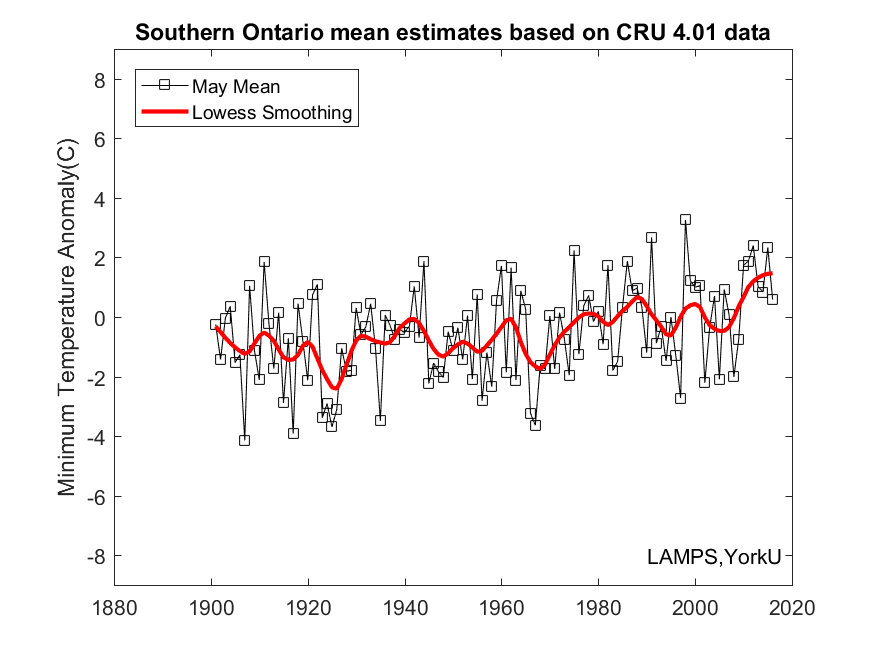
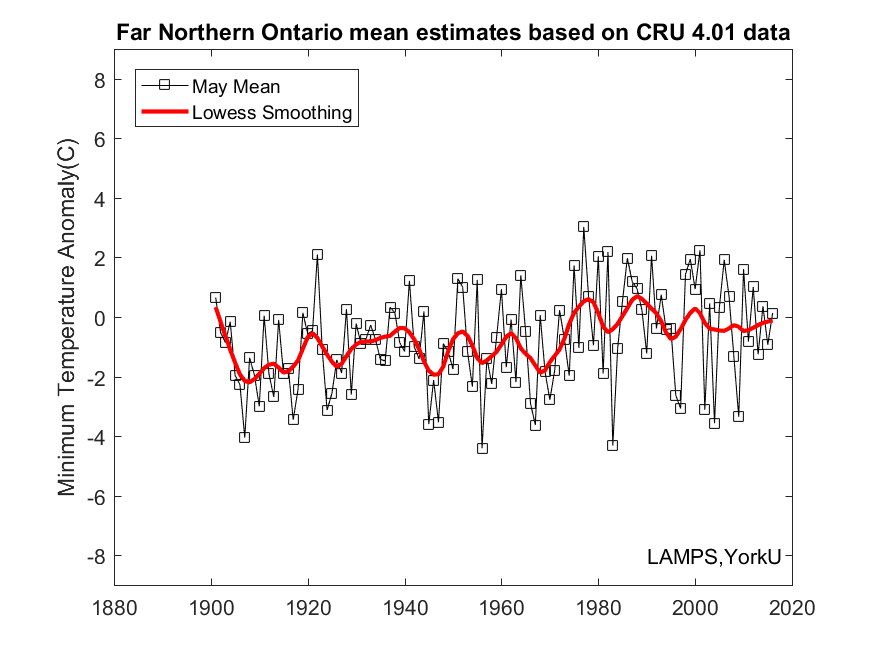
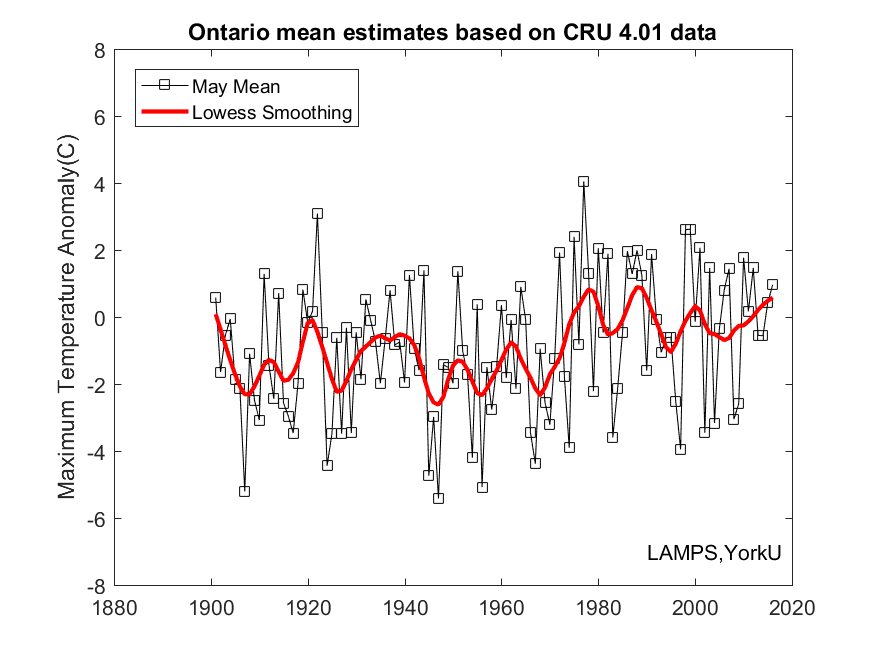
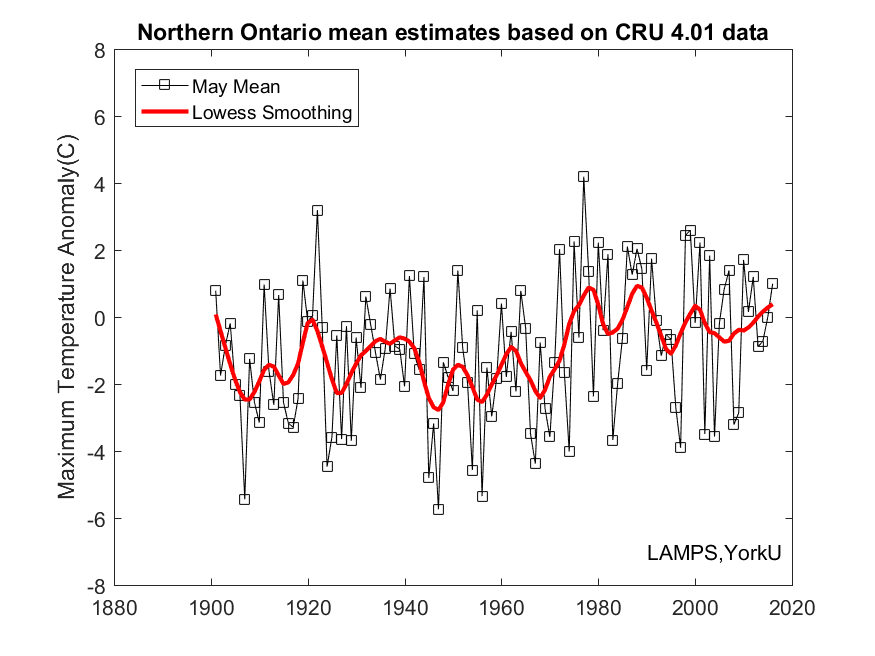
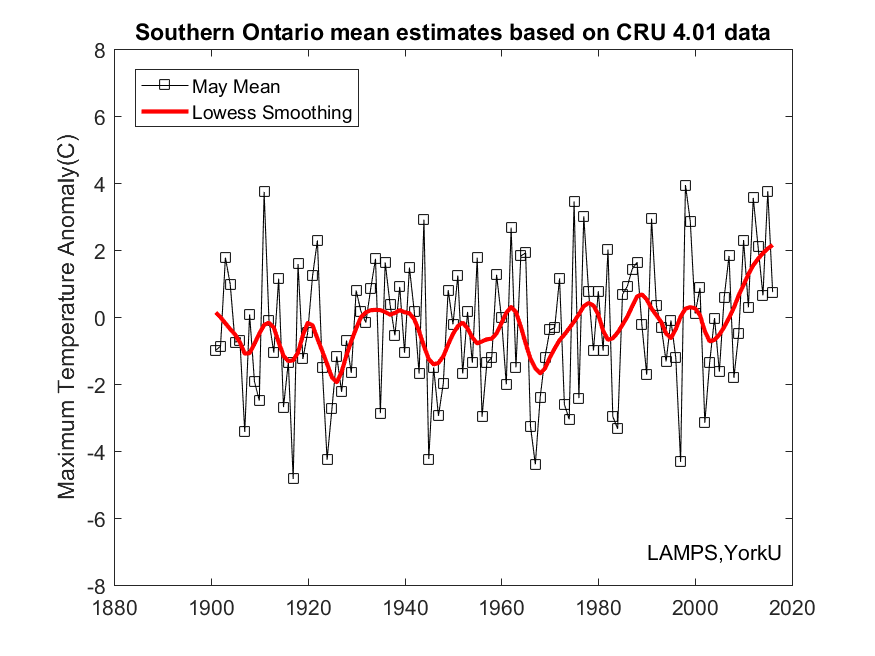
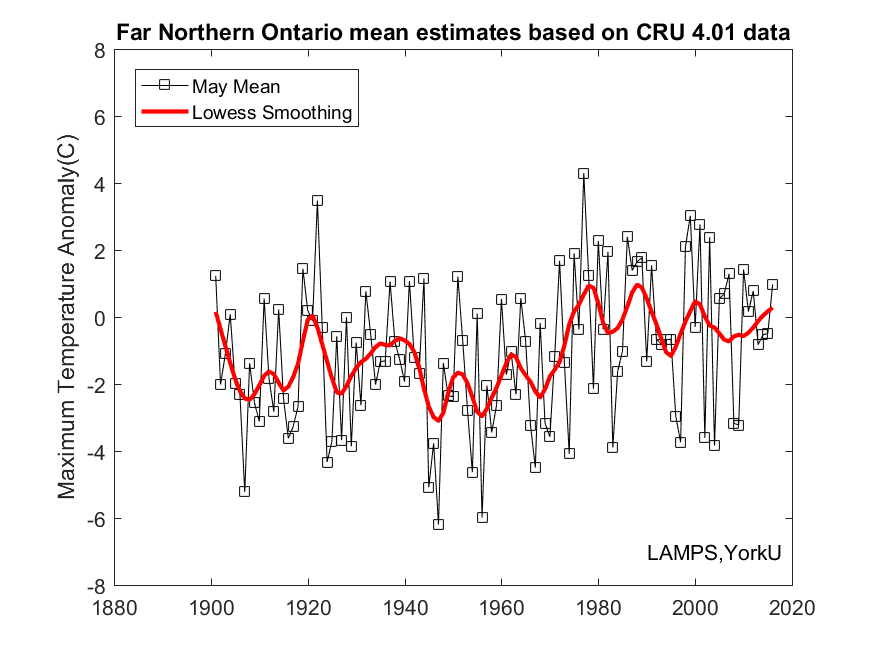
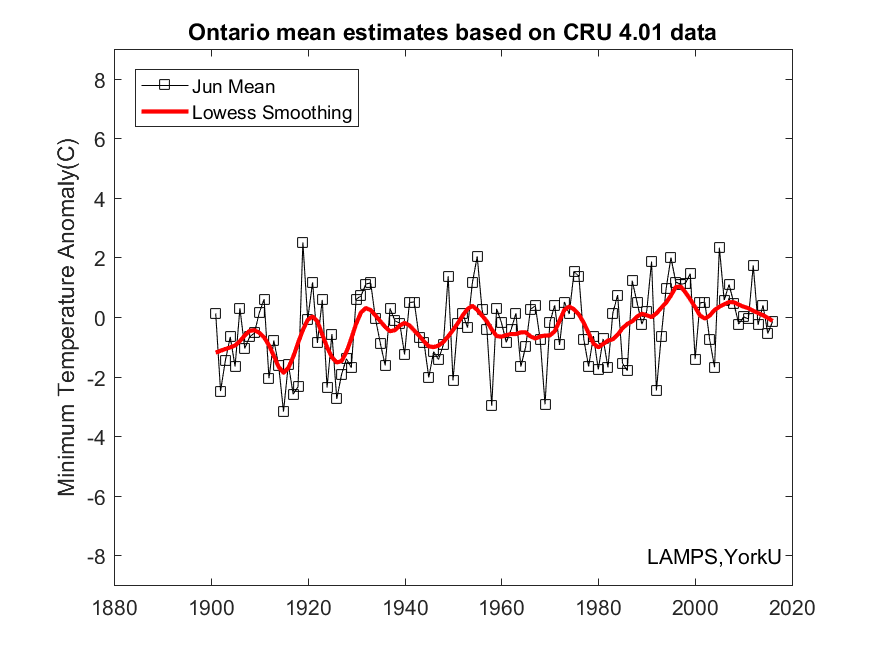
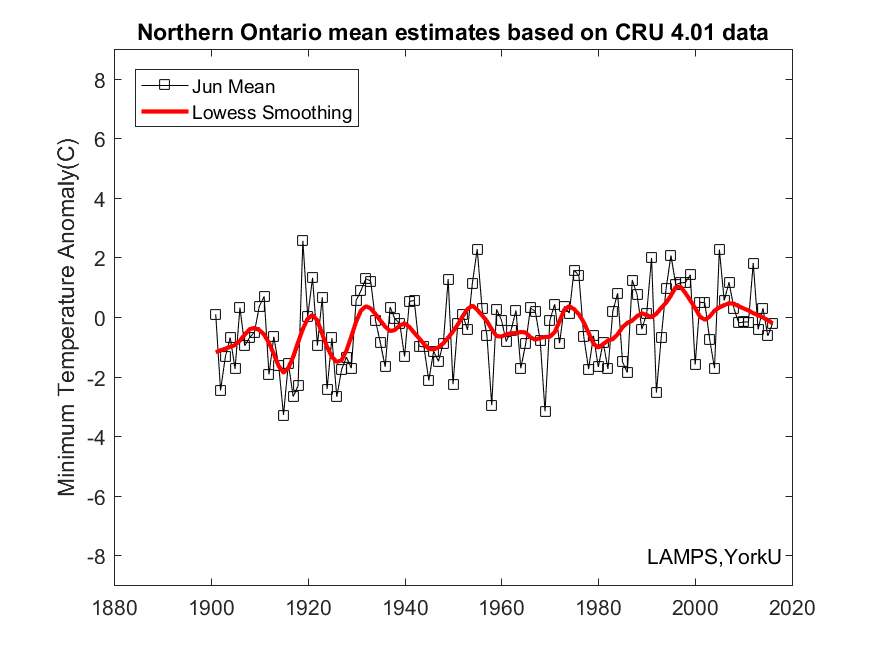
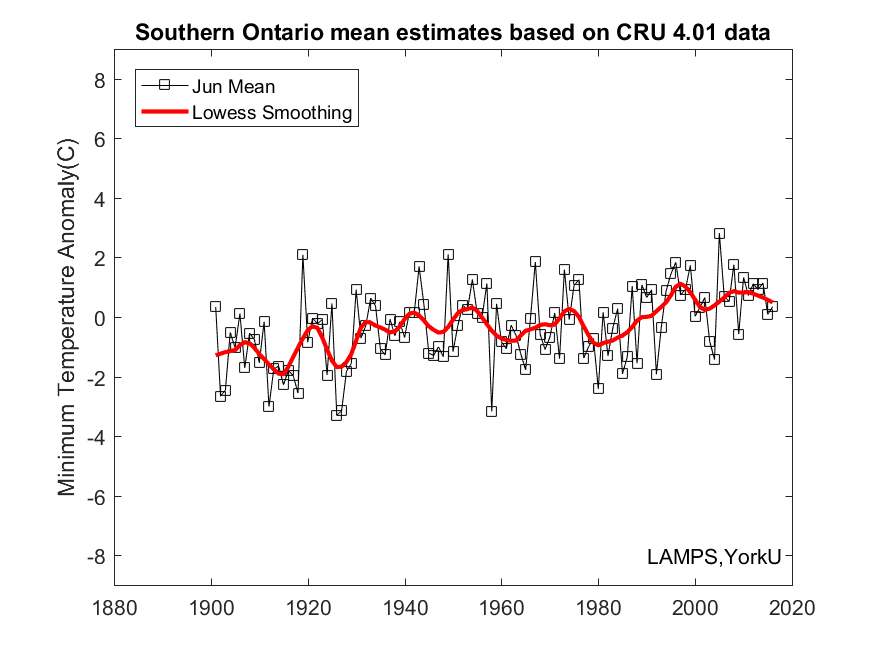
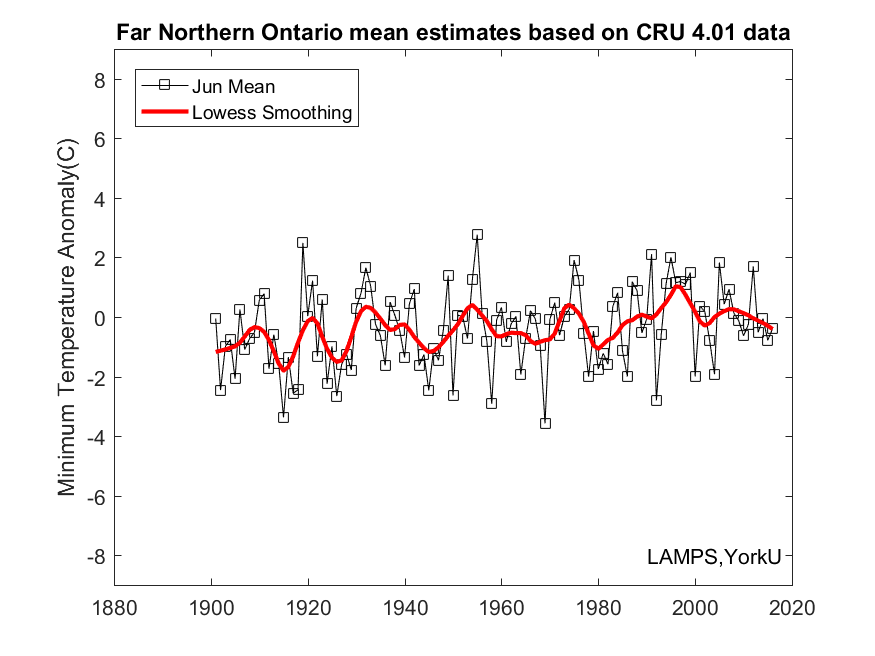
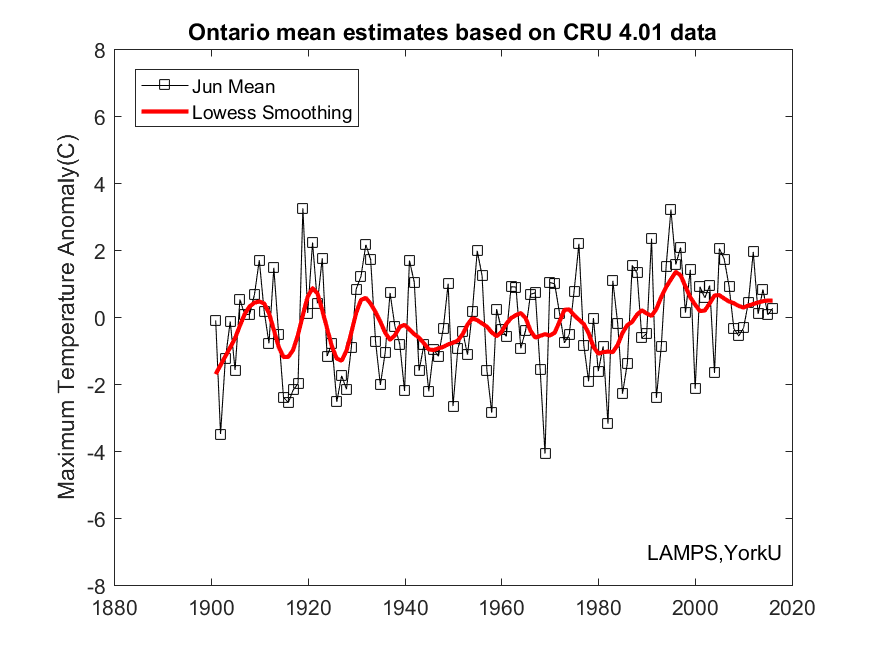
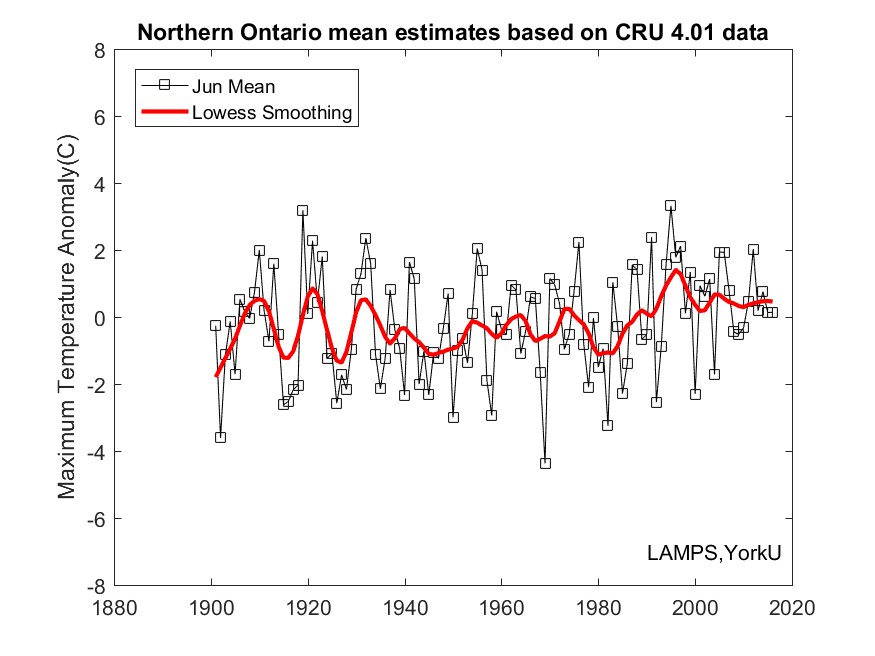
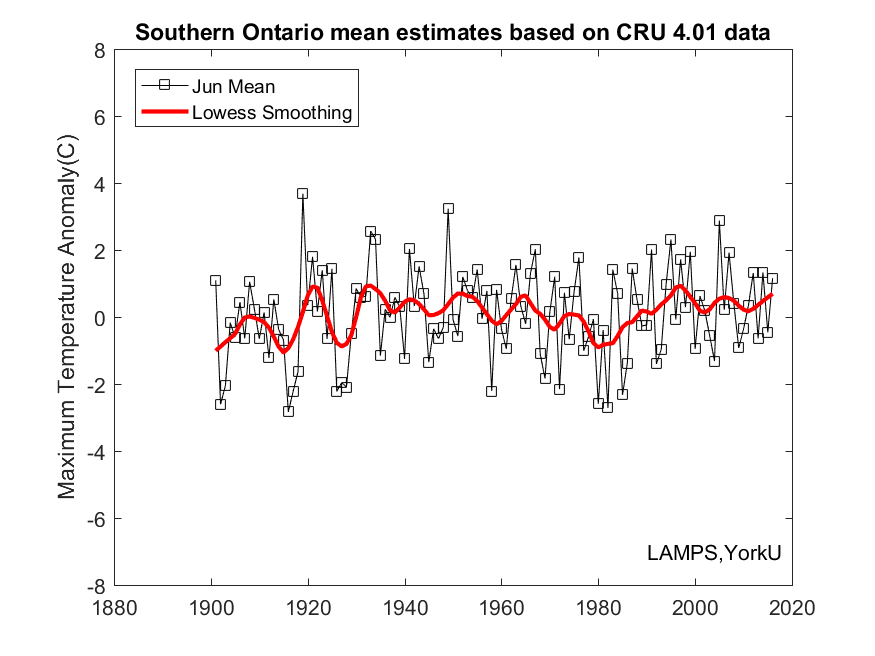
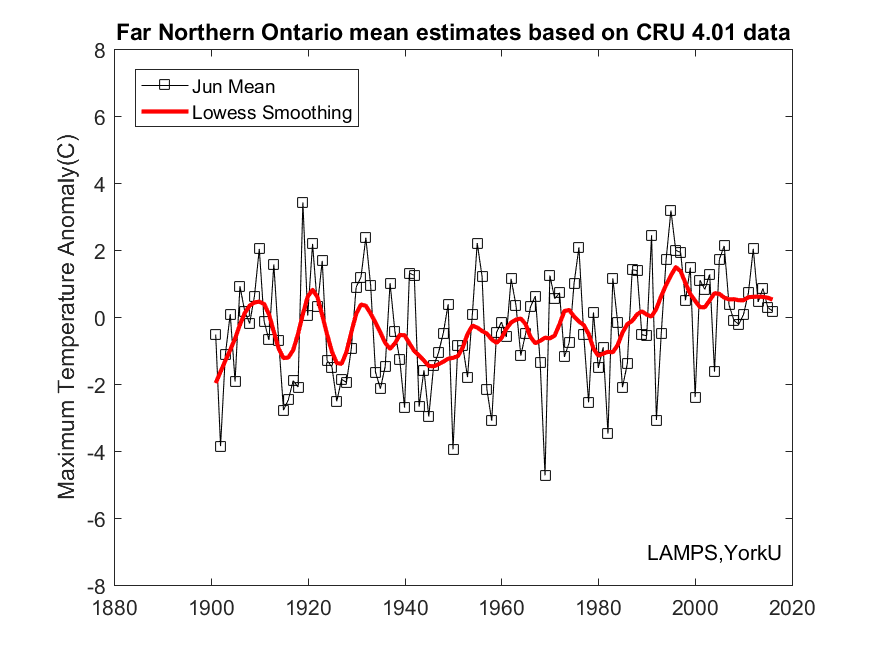
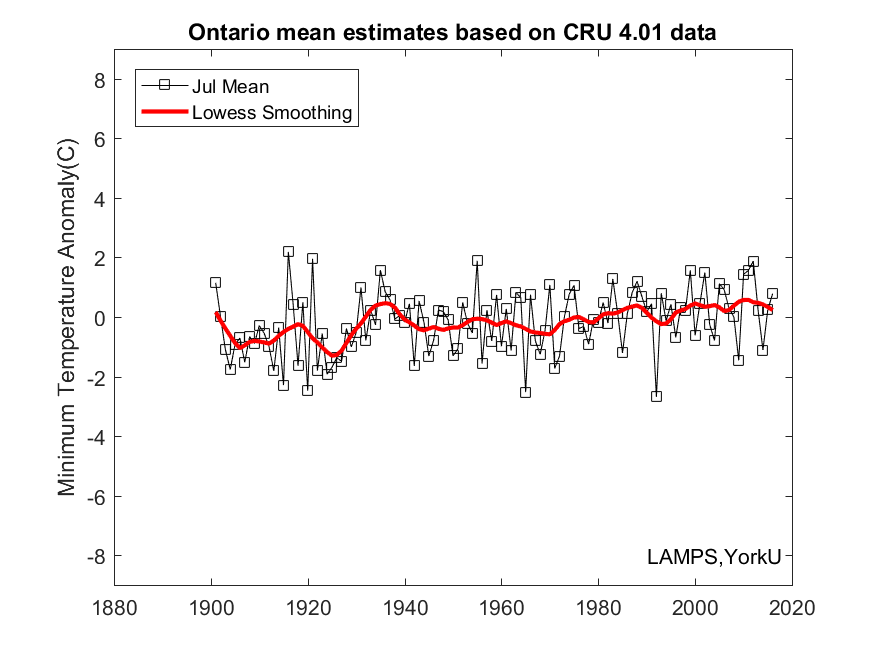
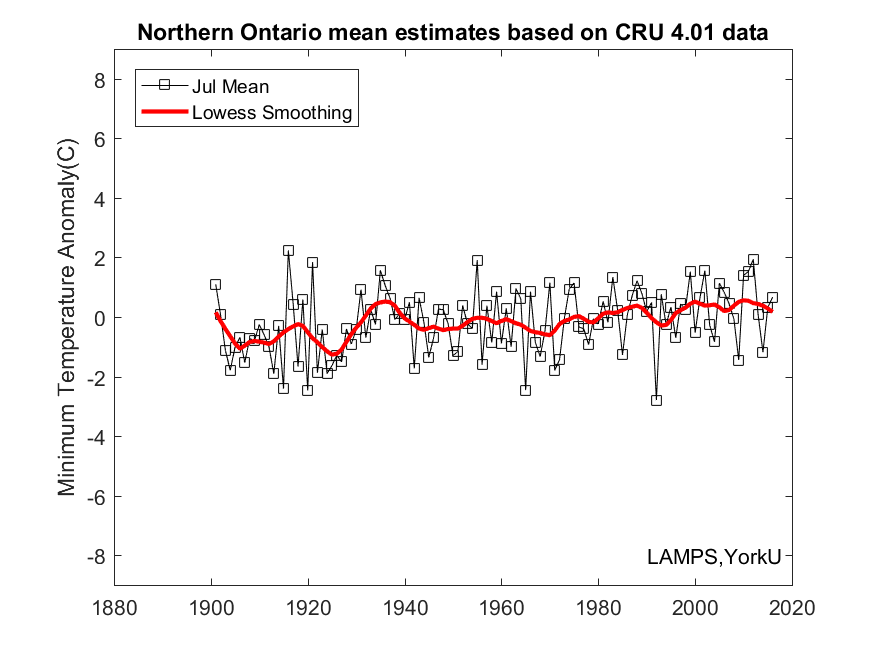
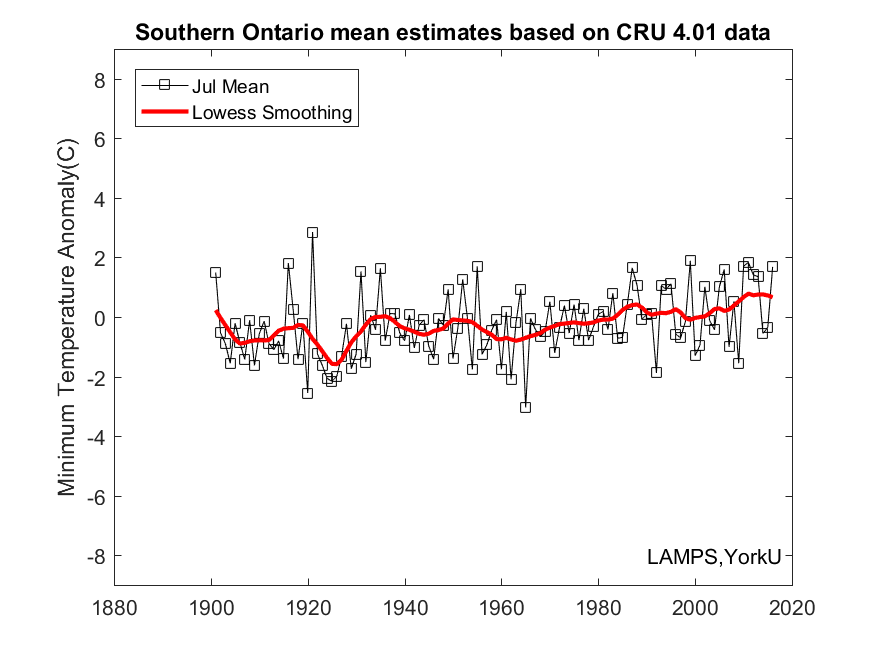
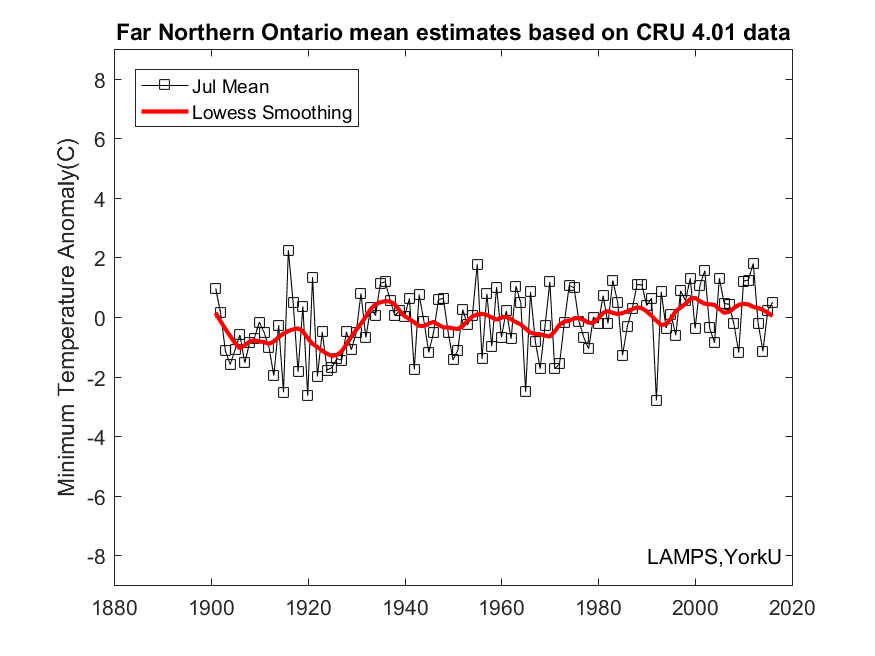
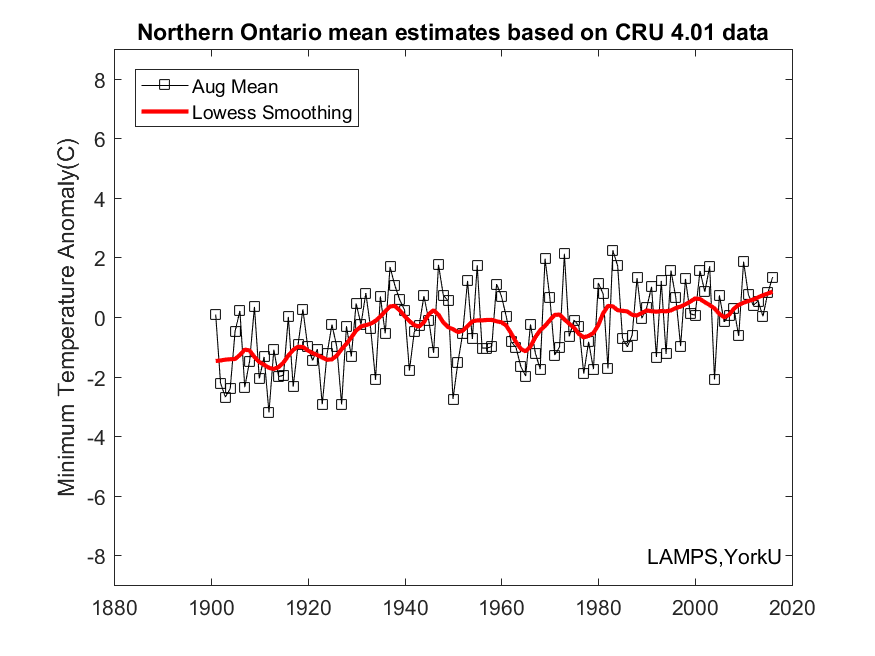
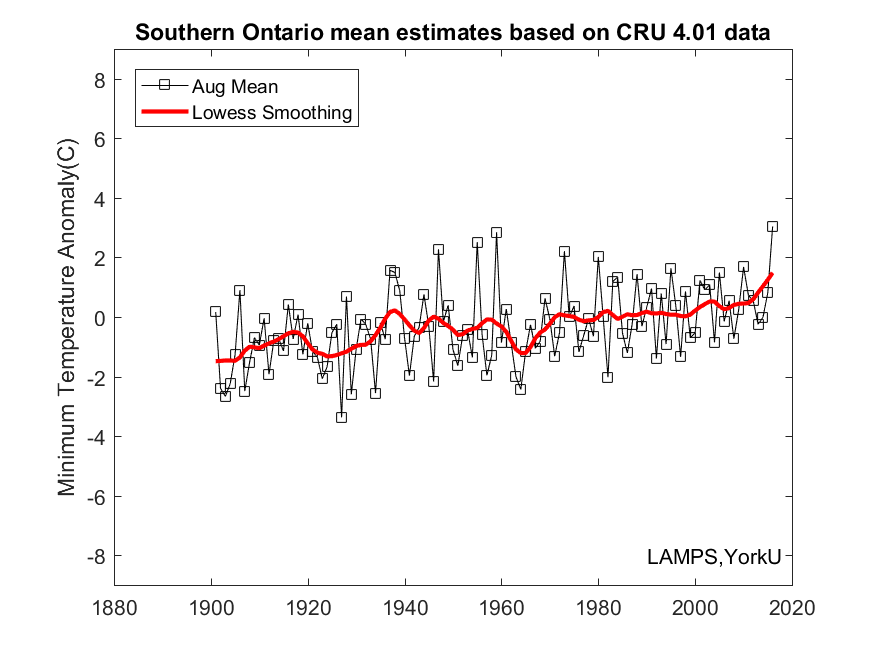
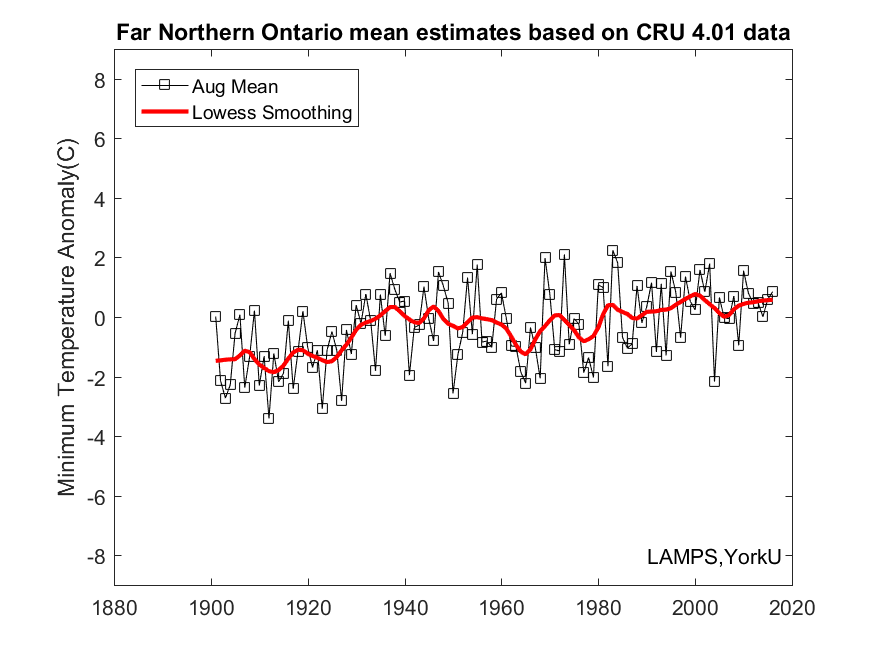
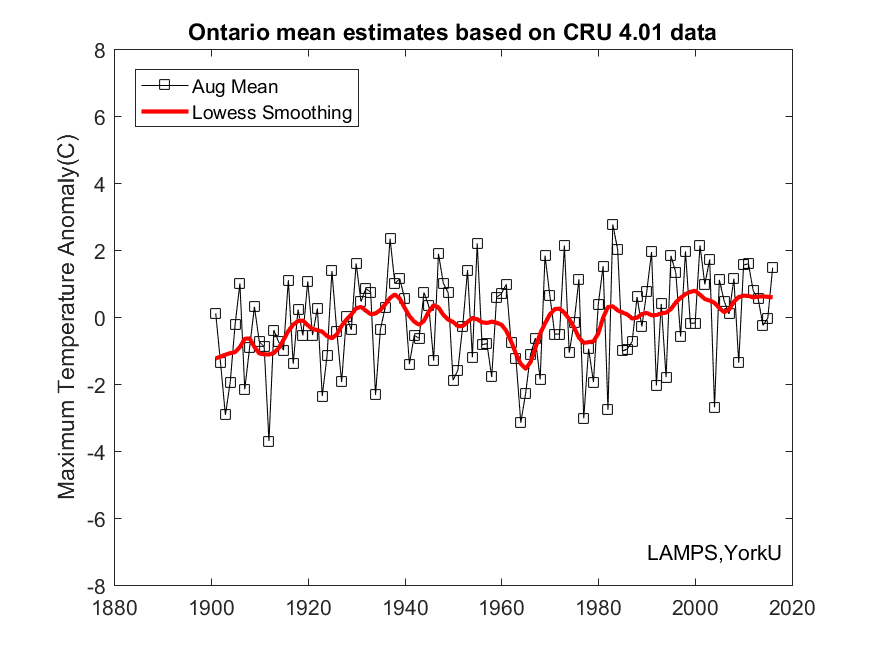
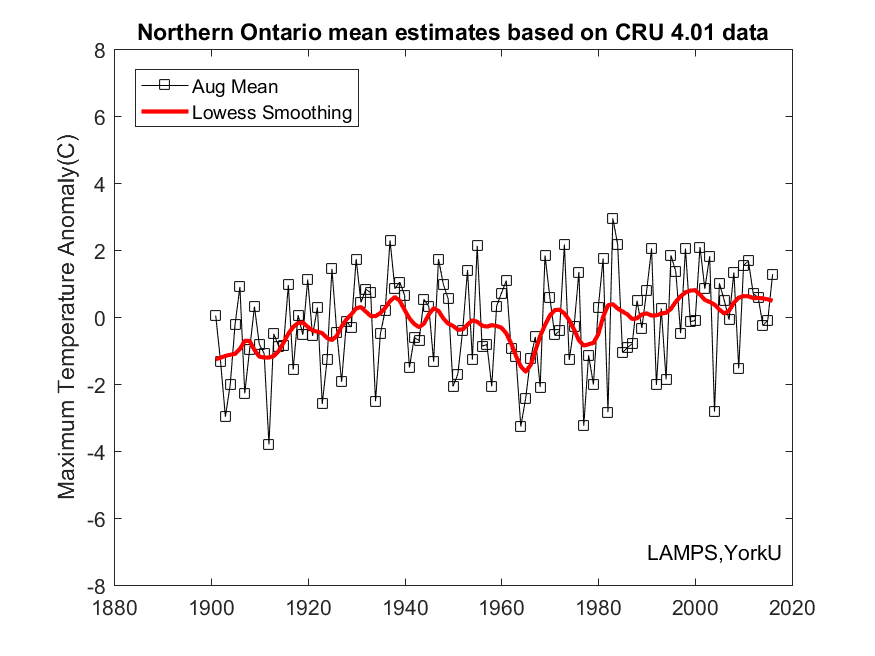
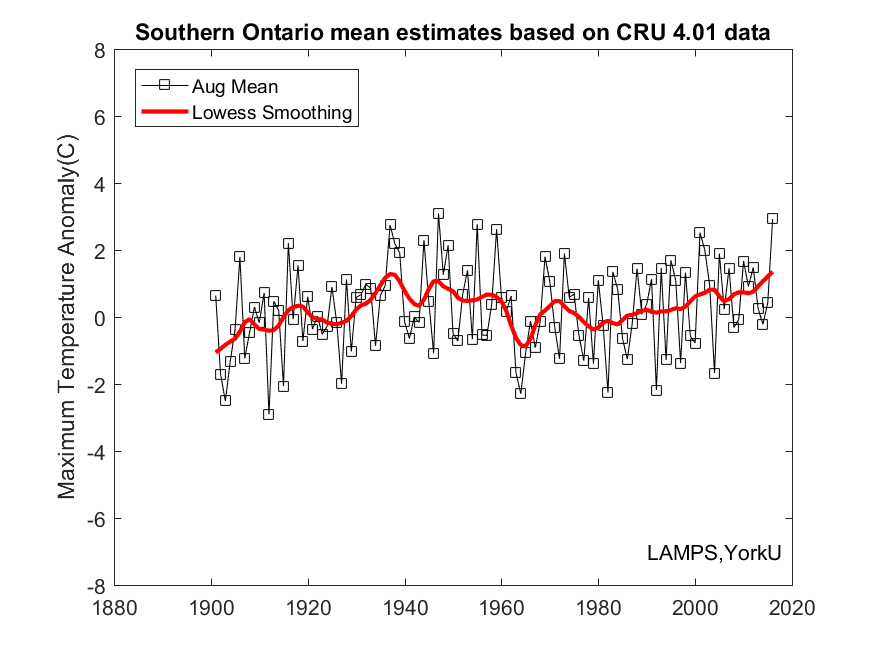
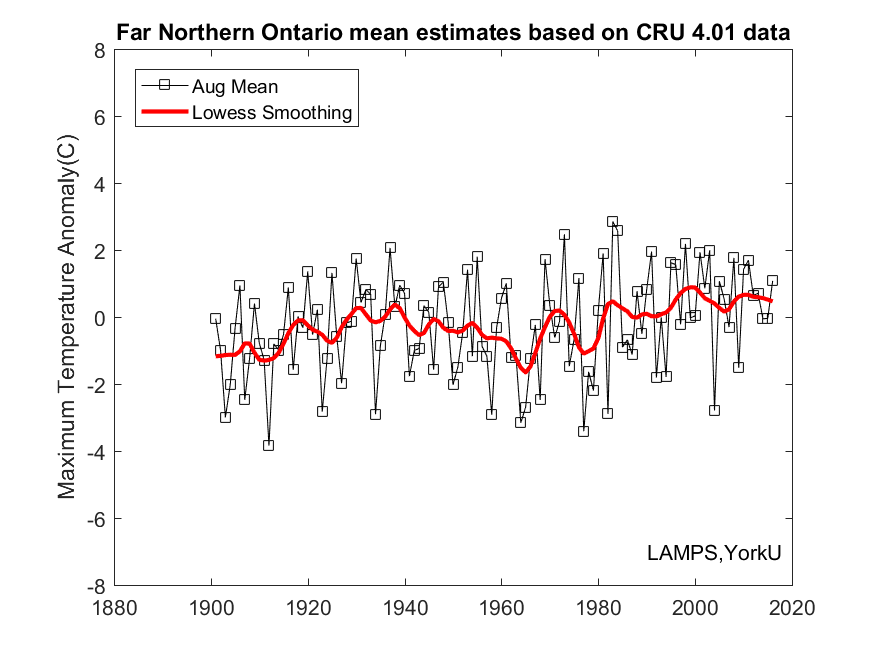
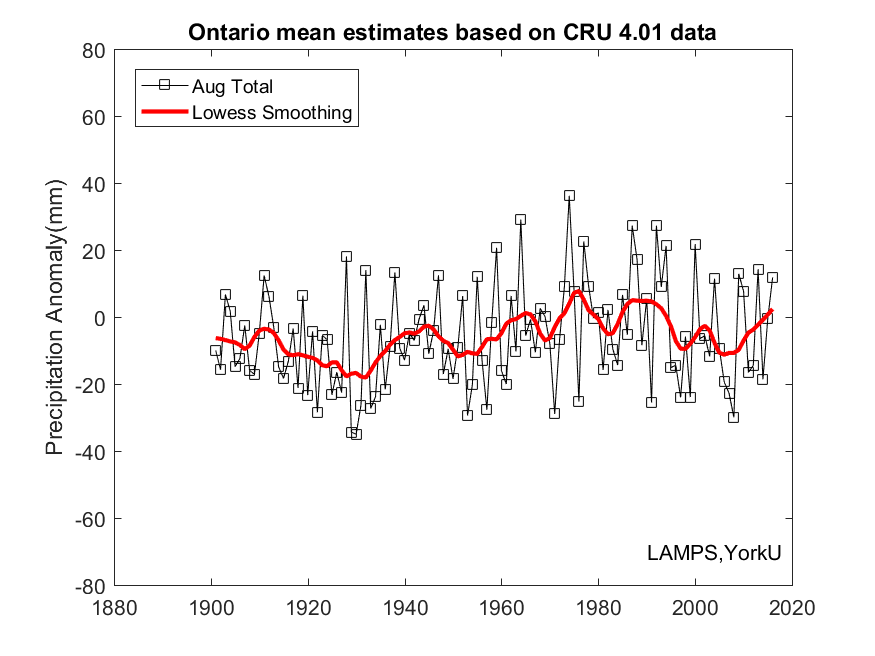
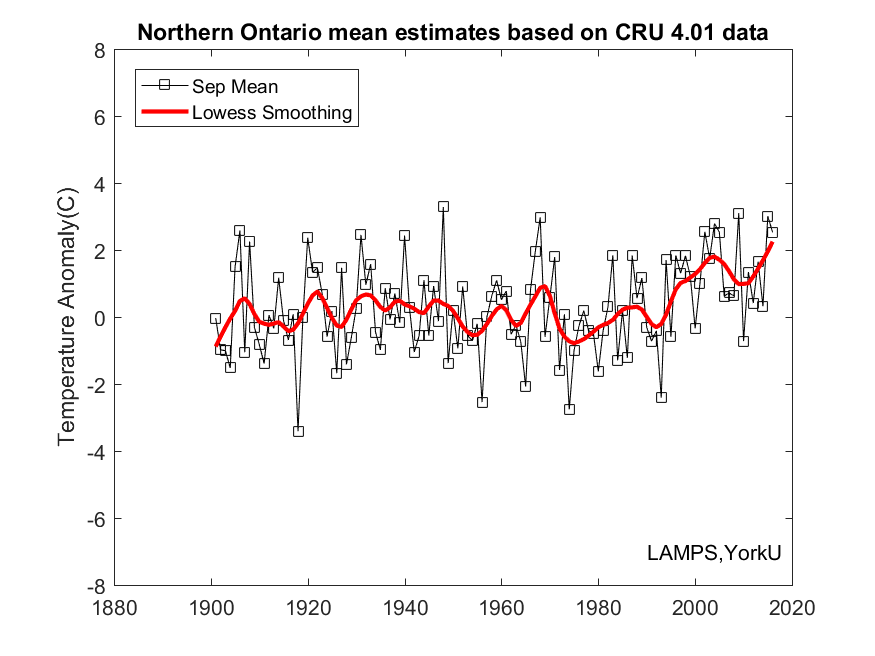
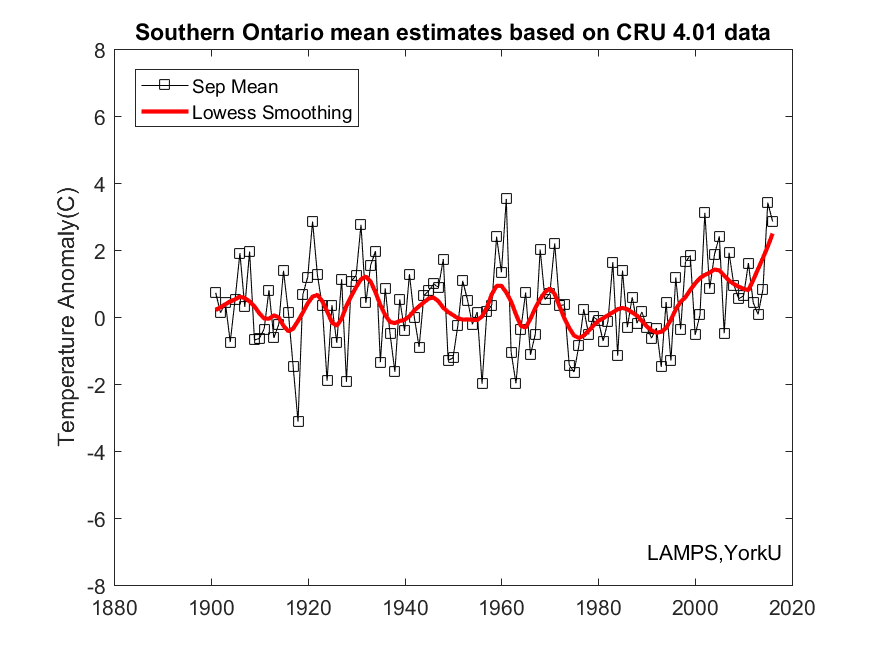
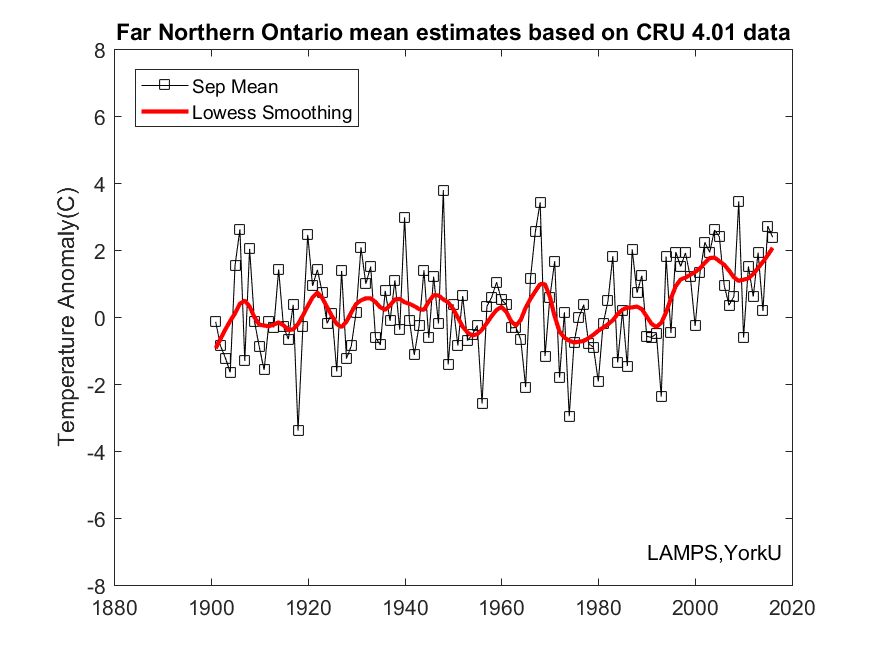
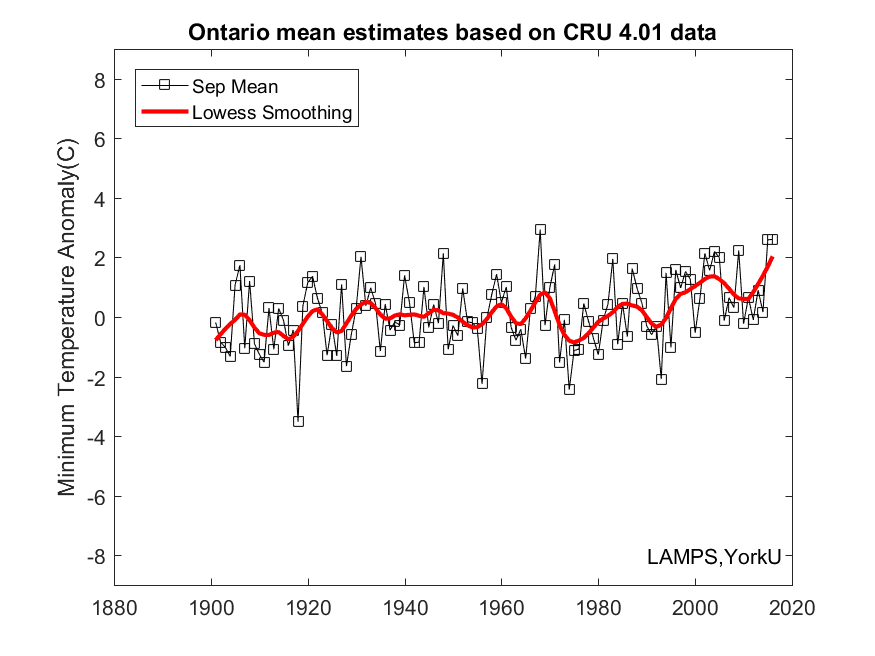
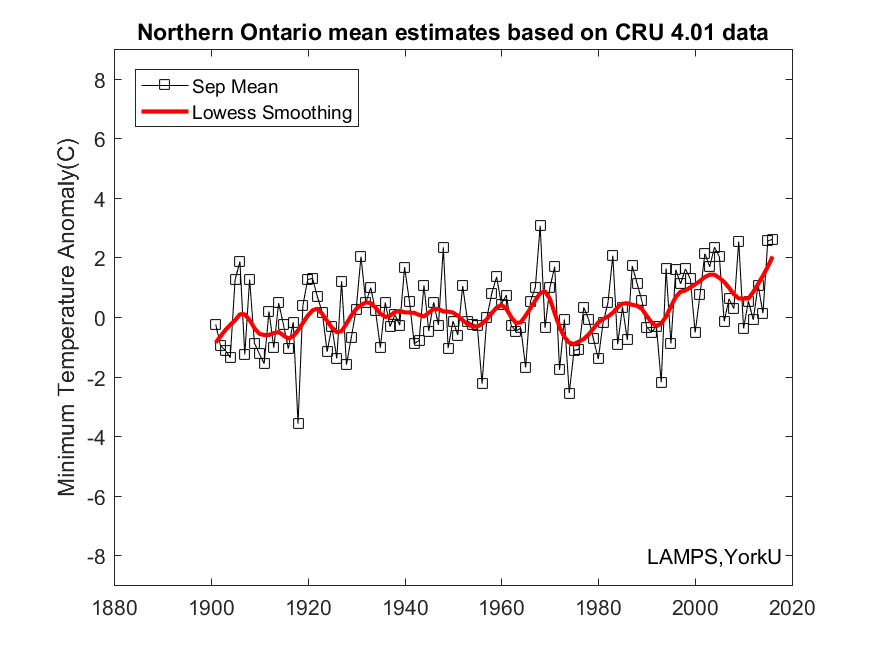
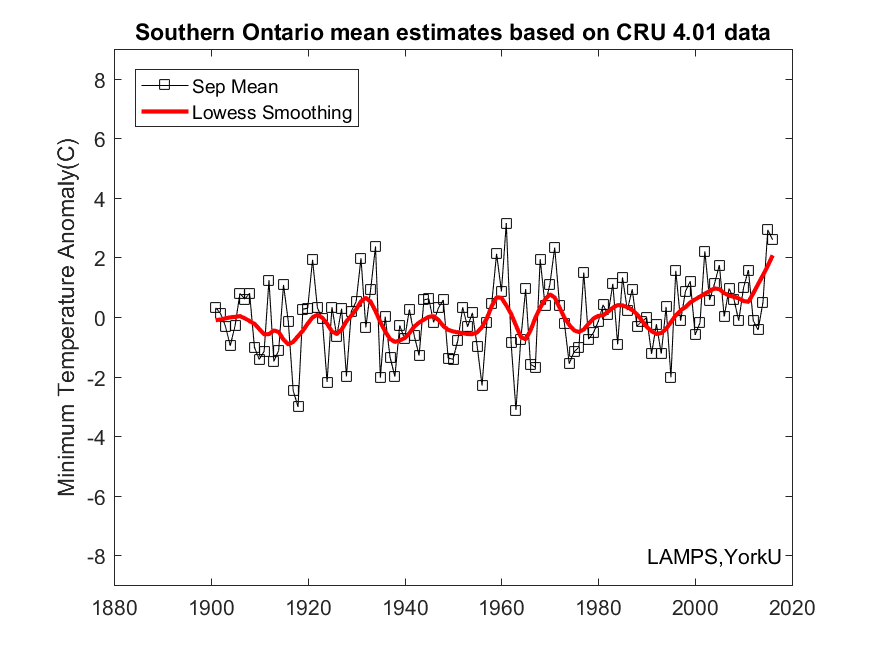
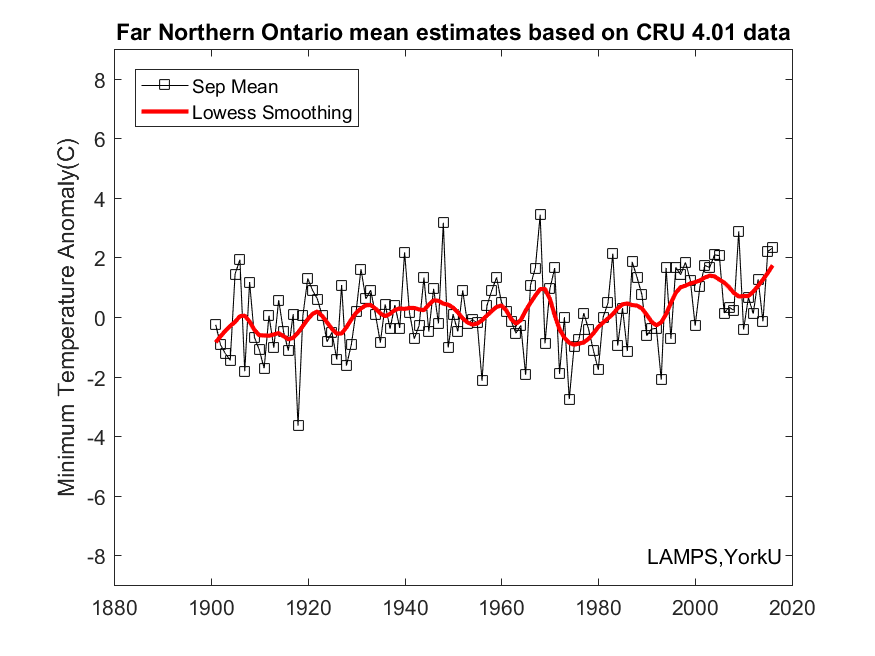
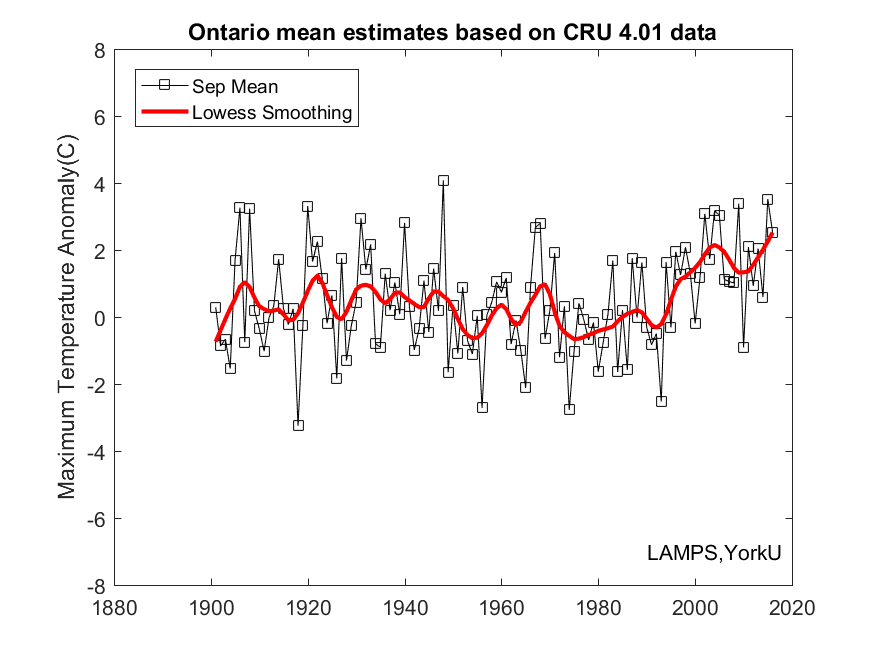
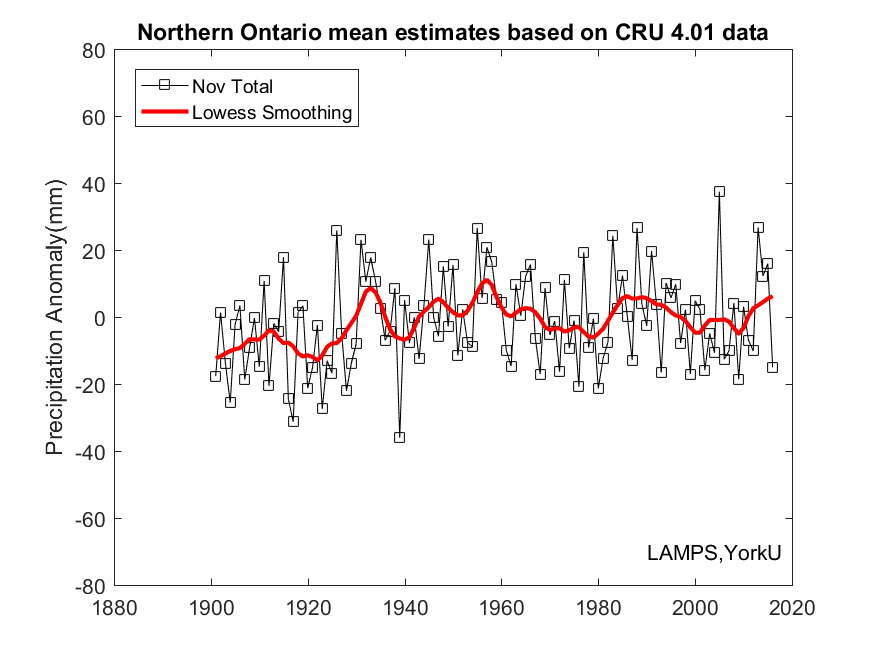
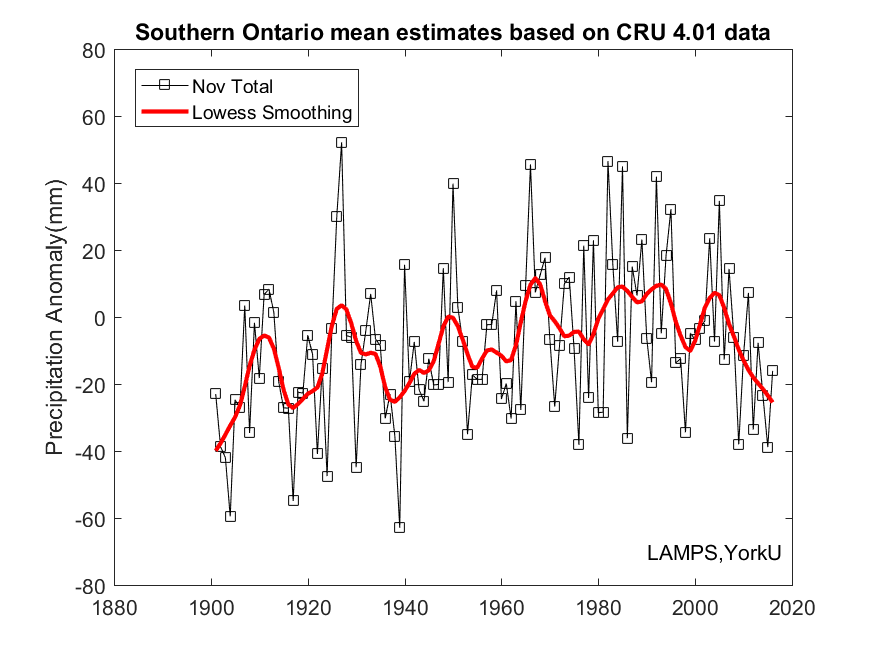
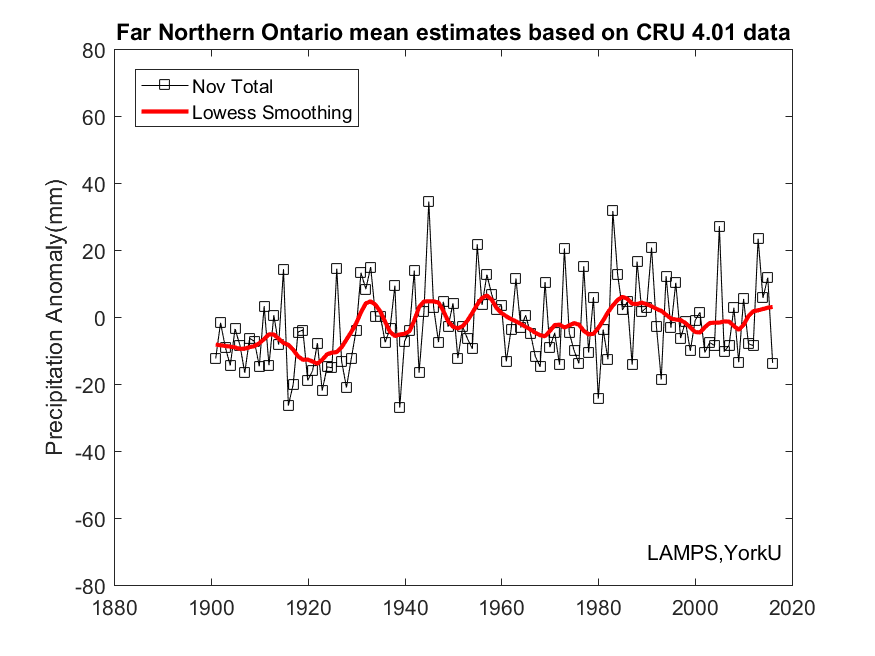
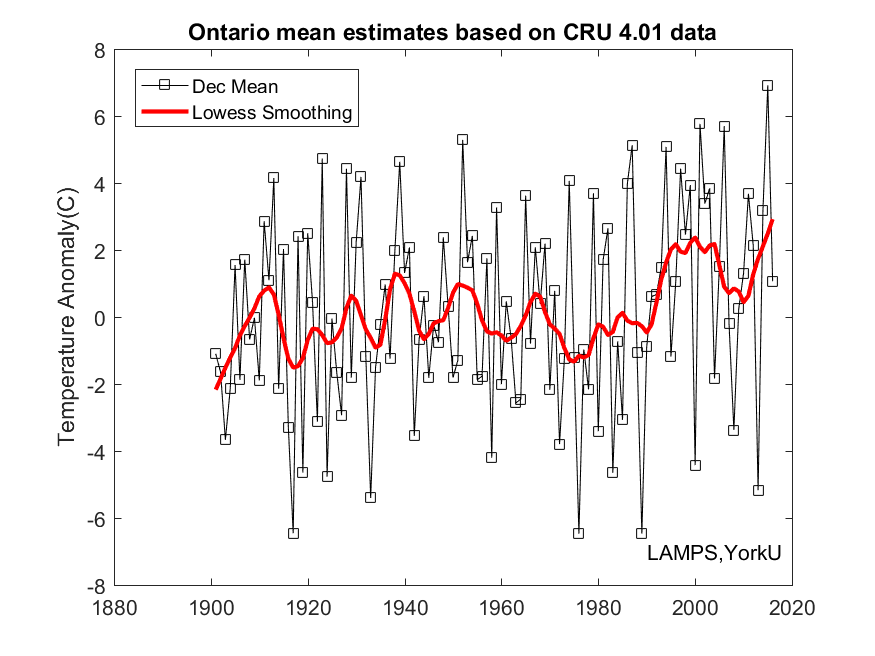
Move mouse to check the variable;click the number to download the figure
| Time | Tas | Tmn | Tmx | Pre | ||||||||||||
| 1 | 2 | 3 | 4 | 1 | 2 | 3 | 4 | 1 | 2 | 3 | 4 | 1 | 2 | 3 | 4 | |
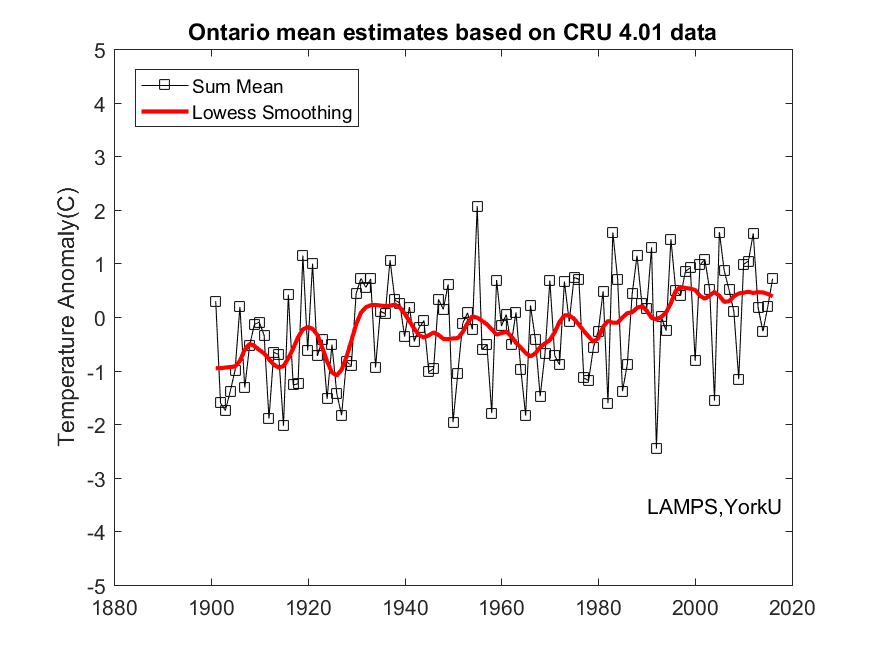
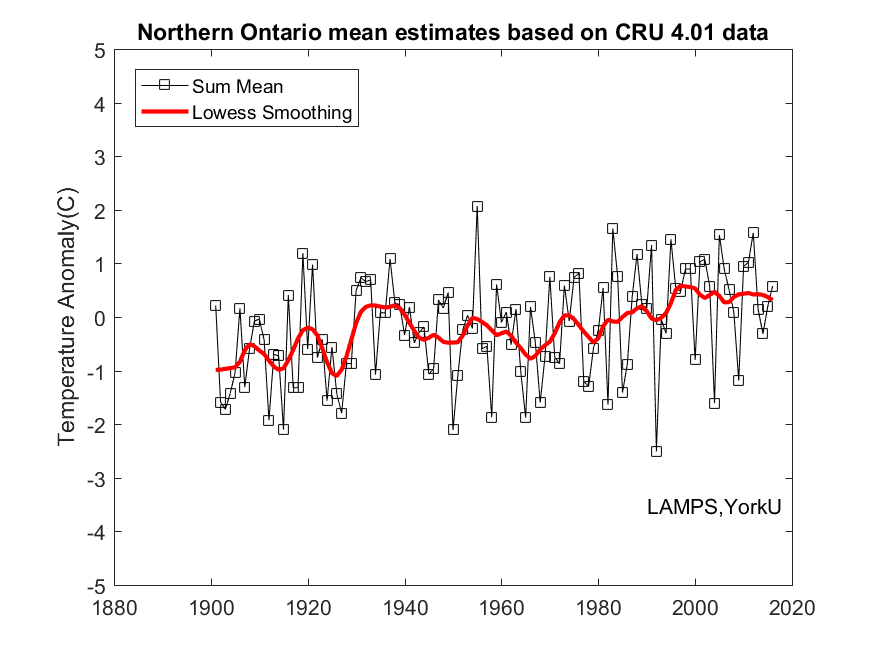
| Ann | 9 | 9 | 3 | 11 | 9 | 9 | 3 | 10 | 9 | 10 | 3 | 11 | 11 | 10 | 52 | 28 |
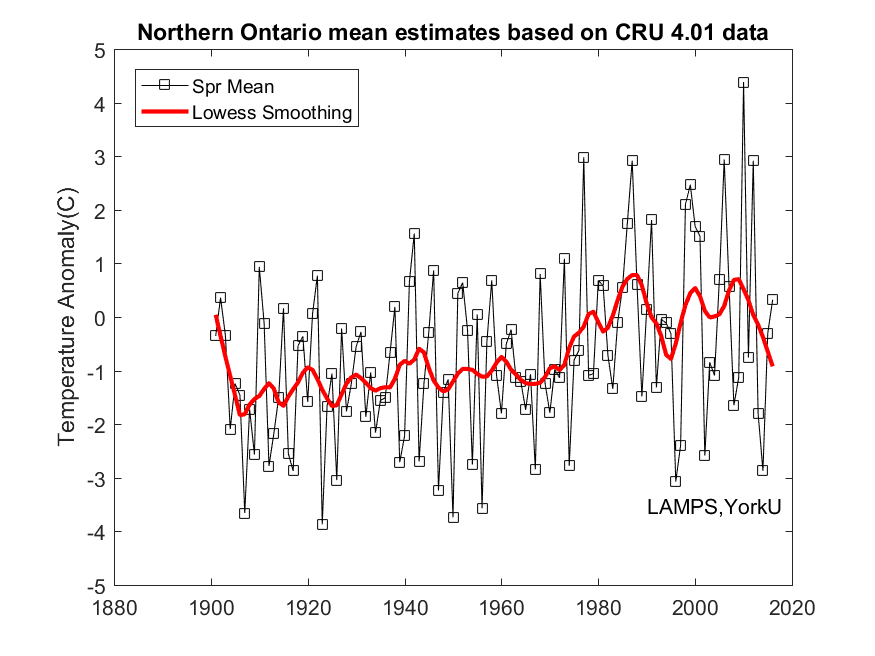
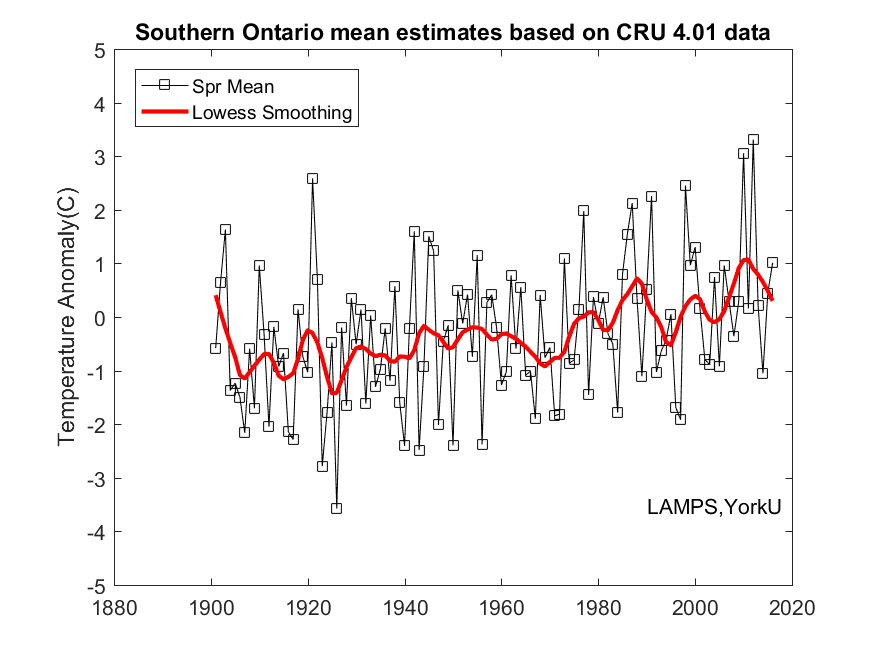
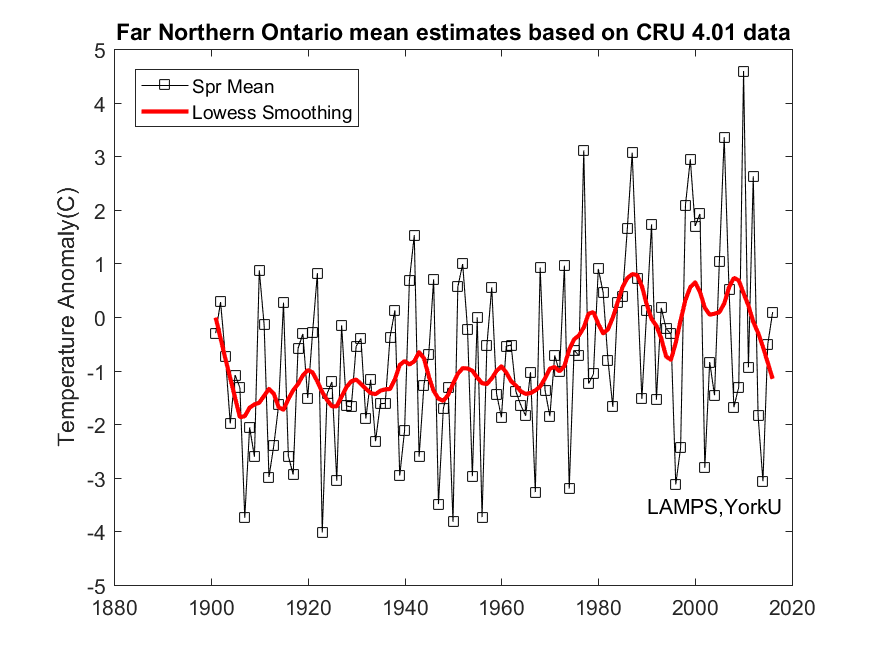
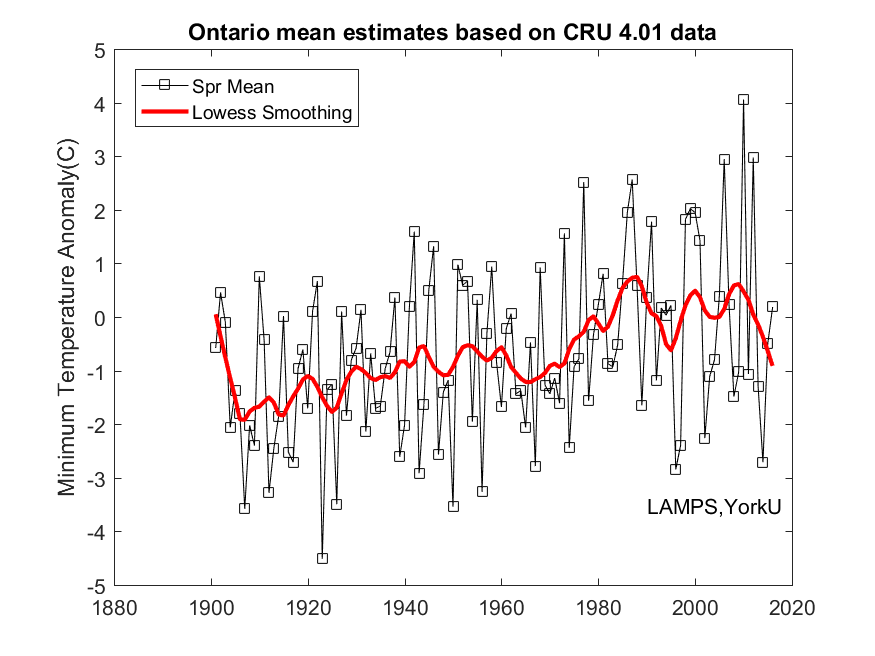
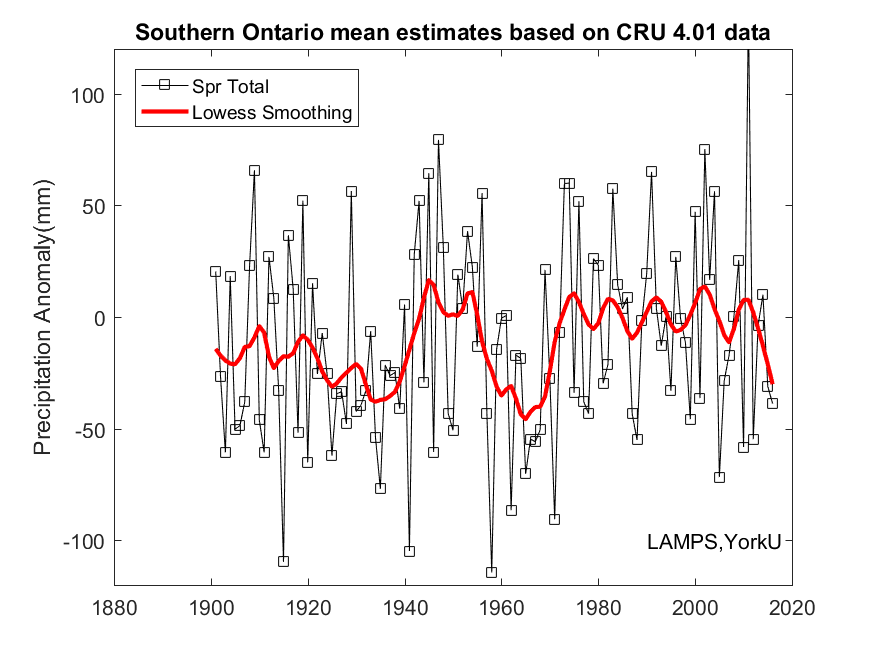
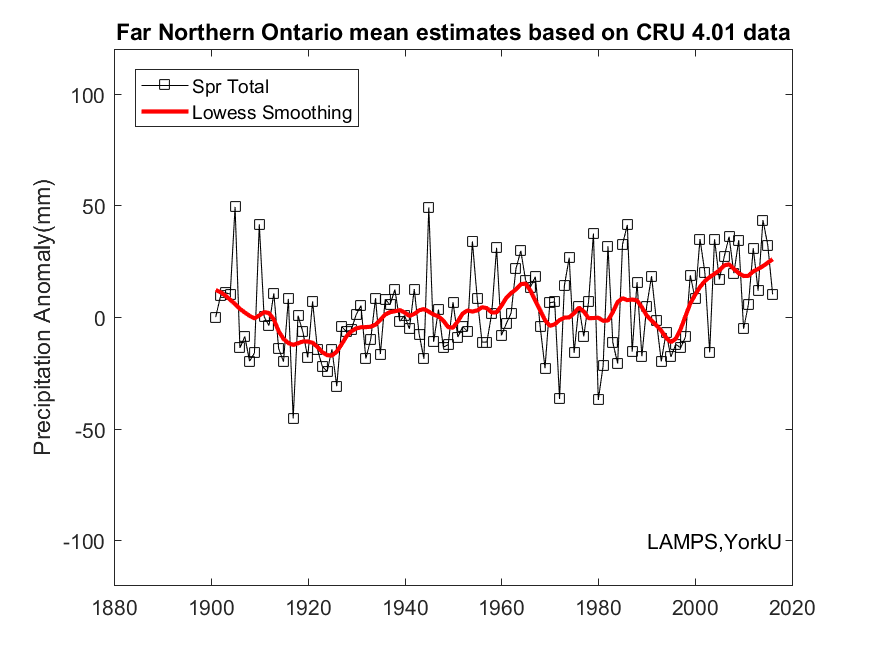
| Spr | 28 | 29 | 16 | 34 | 35 | 39 | 18 | 42 | 20 | 23 | 15 | 25 | 30 | 23 | 82 | 37 |
| Sum | 20 | 27 | 3 | 32 | 20 | 20 | 2 | 32 | 26 | 33 | 5 | 32 | 36 | 37 | 86 | 38 |
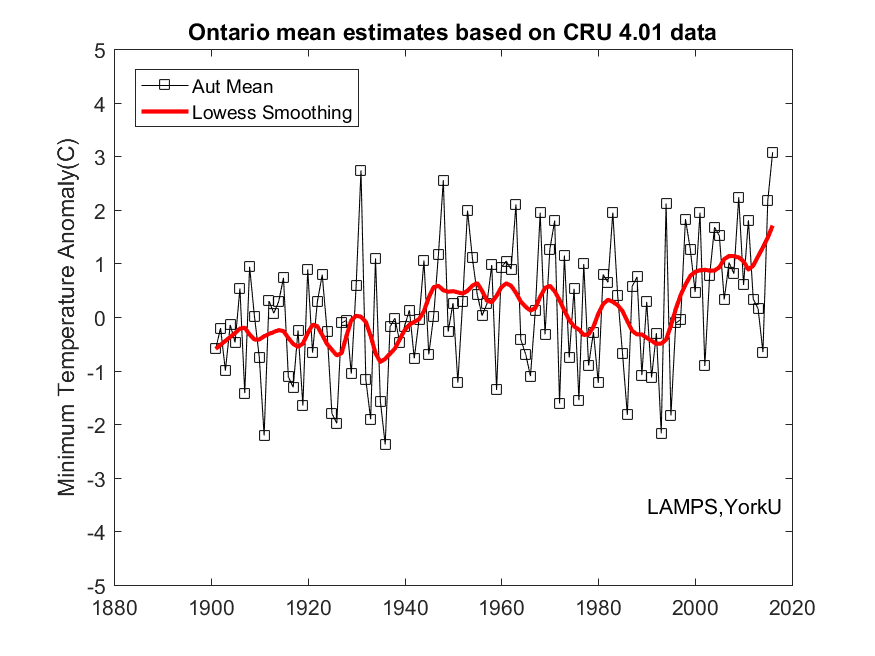
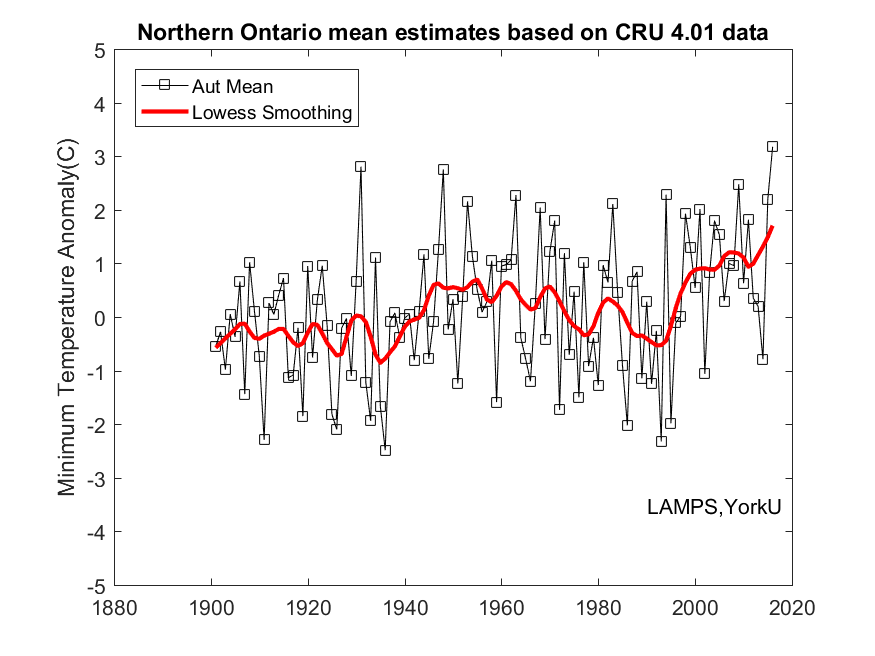
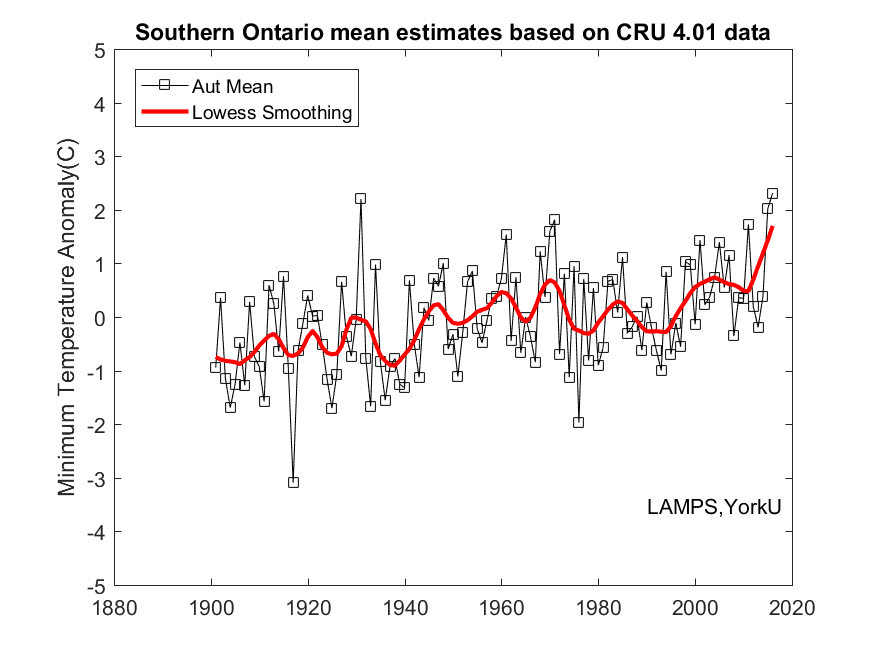
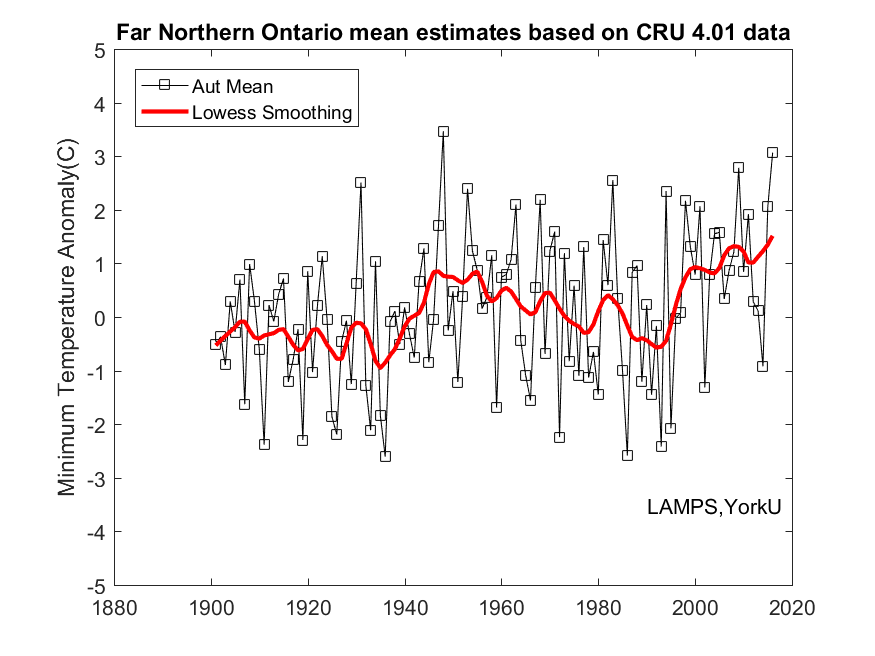
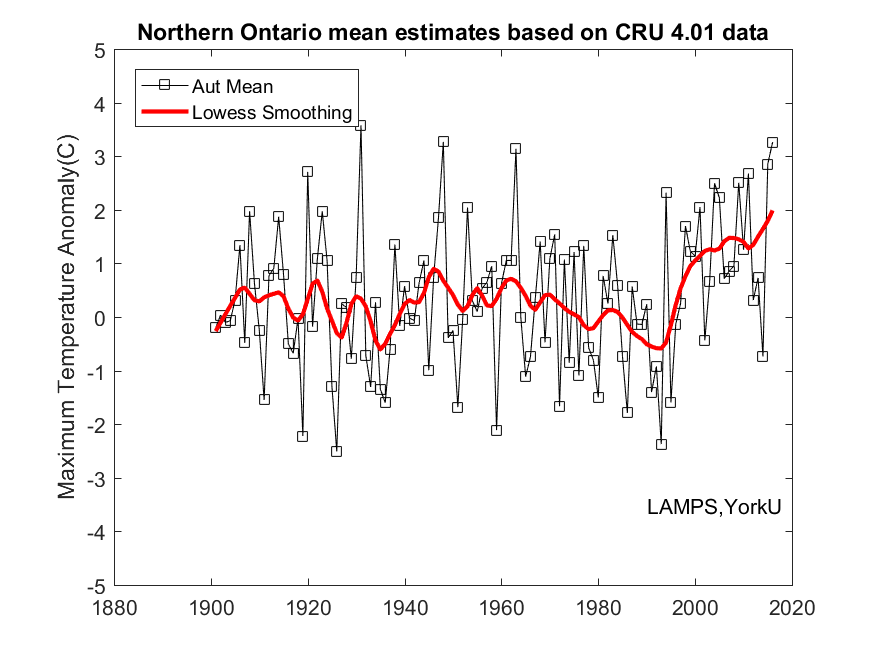
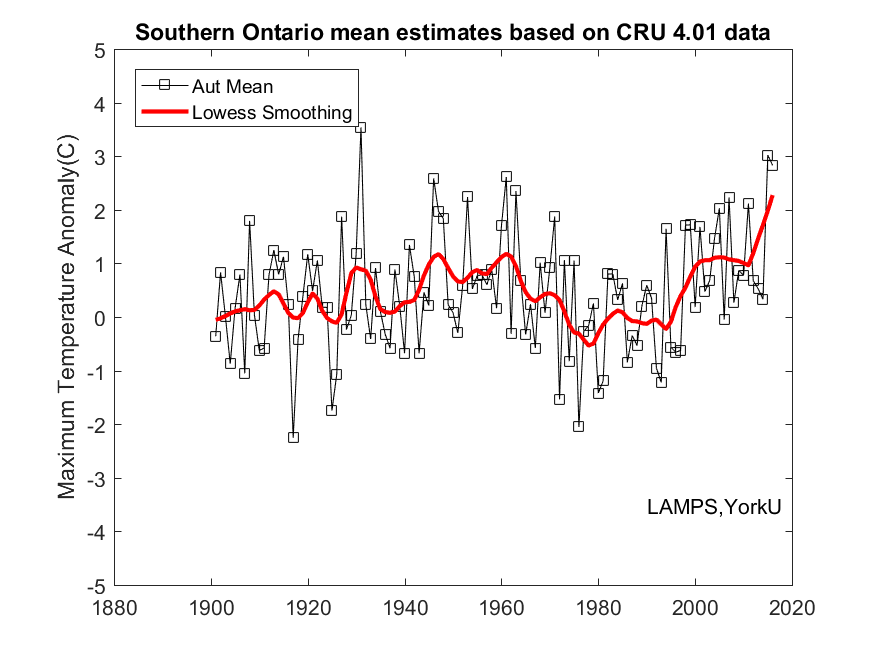
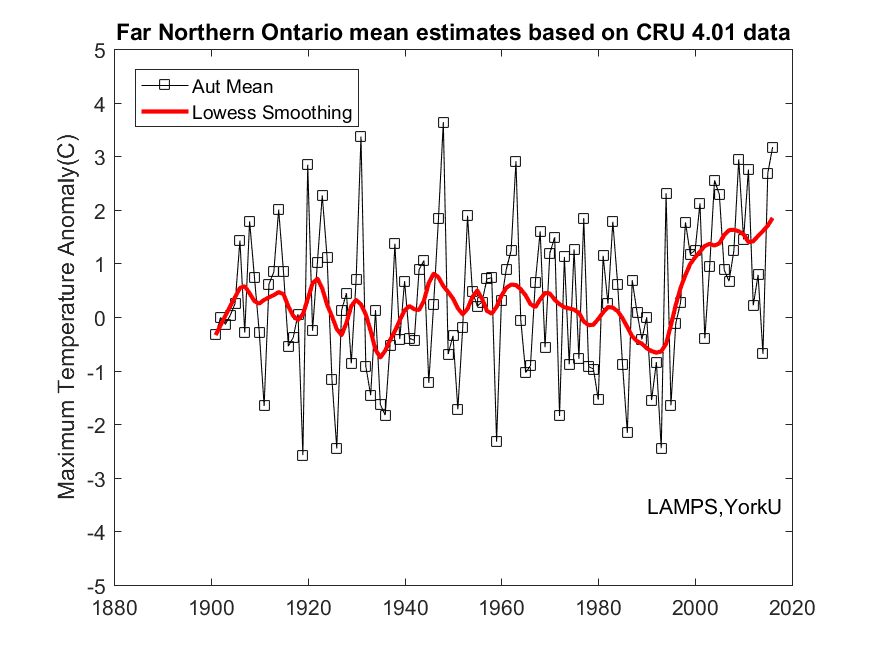
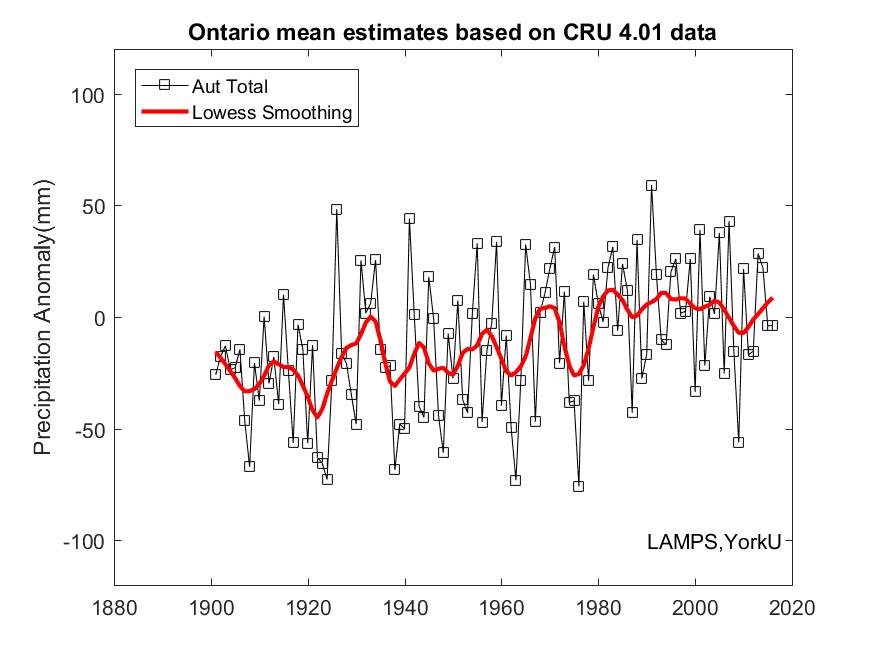
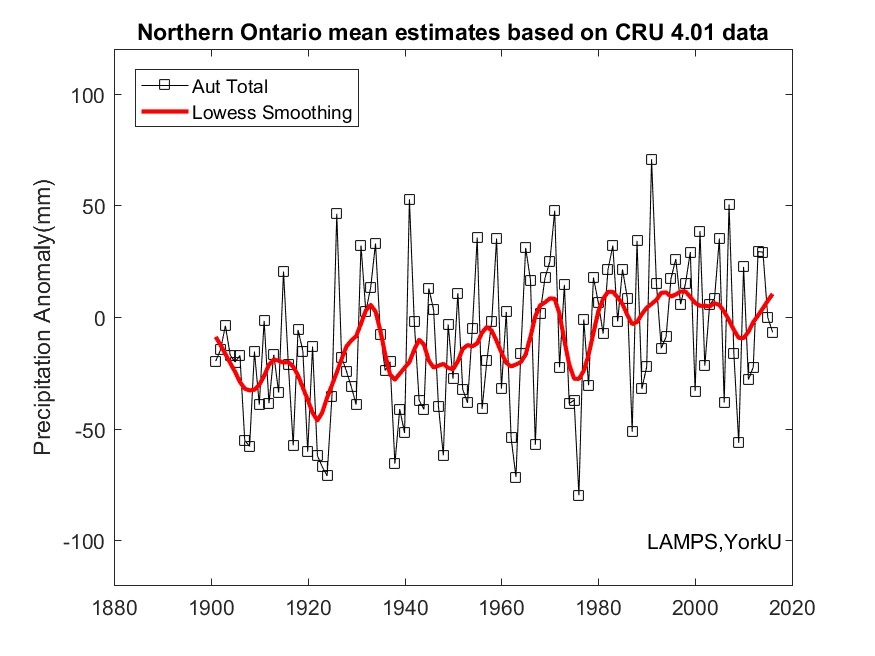
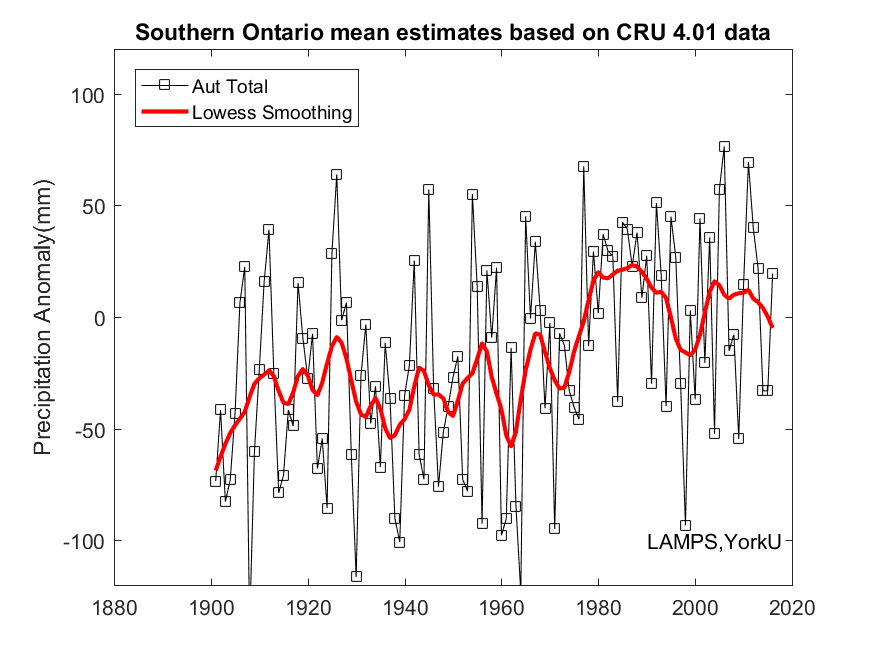
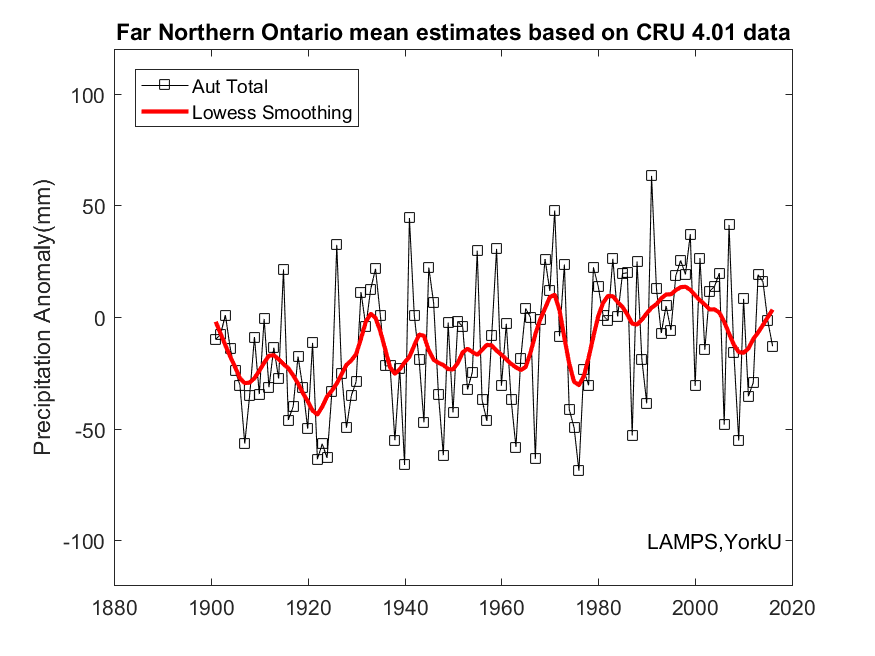
| Aut | 2 | 1 | 2 | 2 | 1 | 1 | 1 | 2 | 2 | 3 | 3 | 3 | 49 | 53 | 32 | 60 |
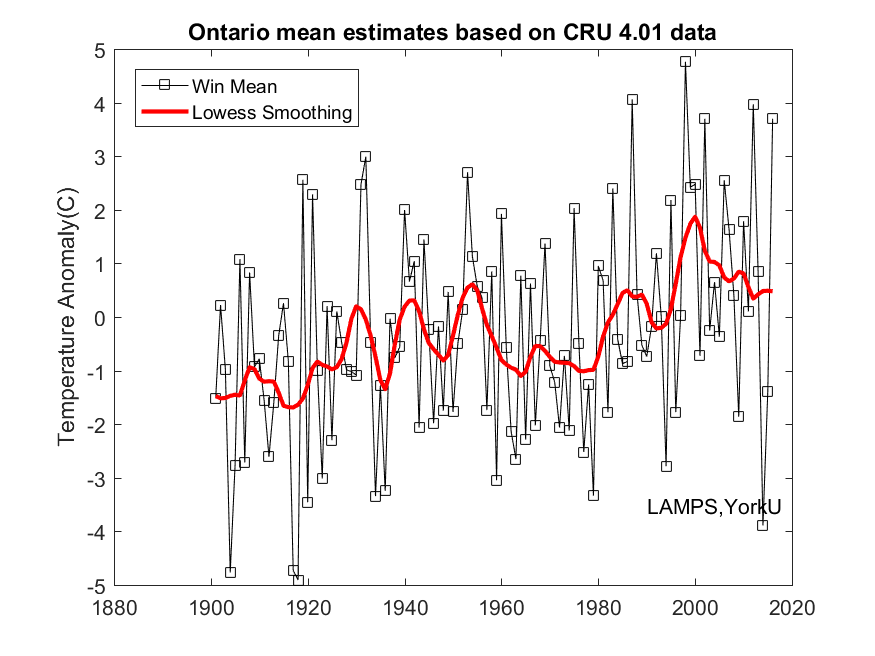
| Win | 4 | 4 | 3 | 4 | 2 | 3 | 3 | 3 | 5 | 6 | 1 | 7 | 2 | 2 | 21 | 10 |
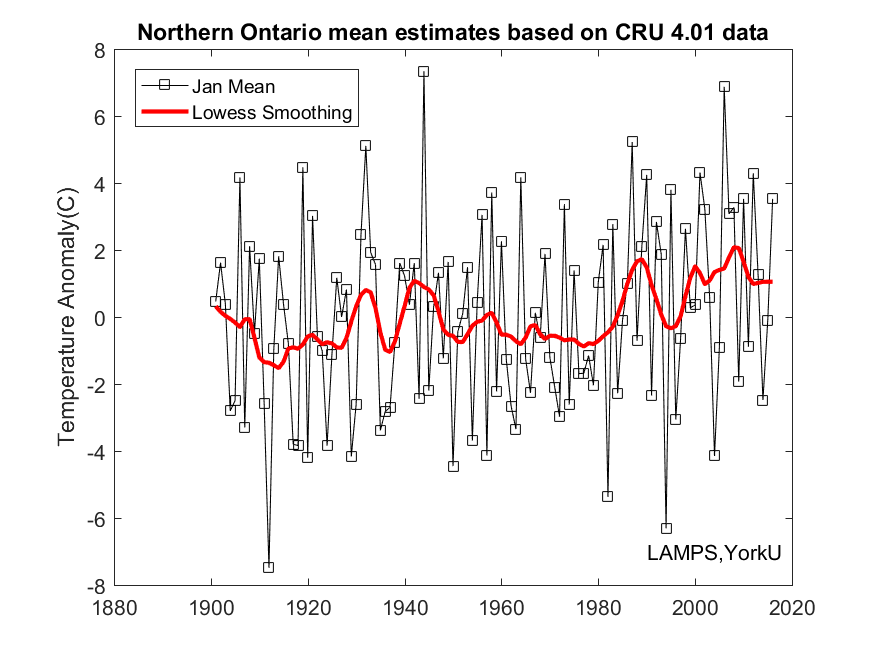
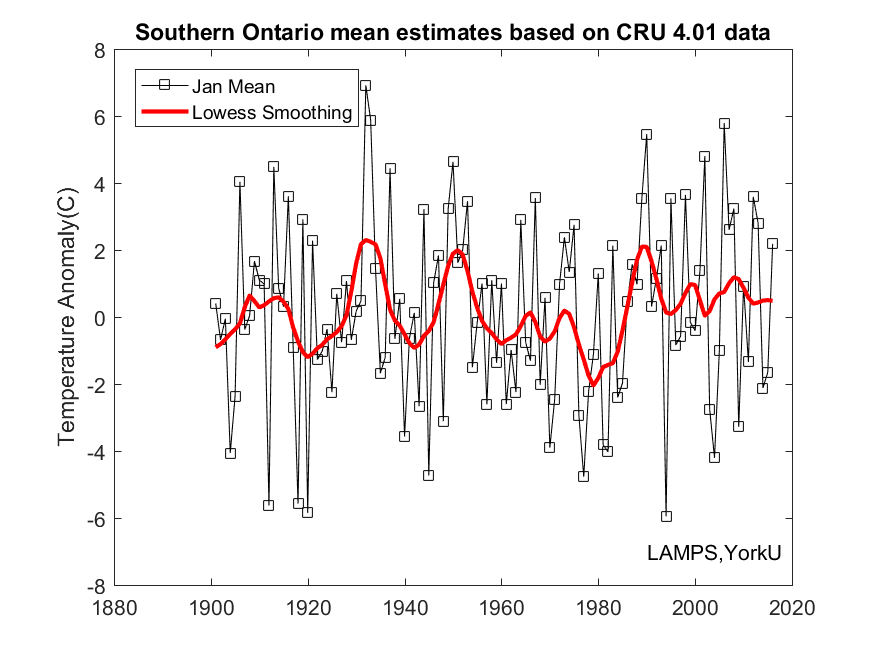
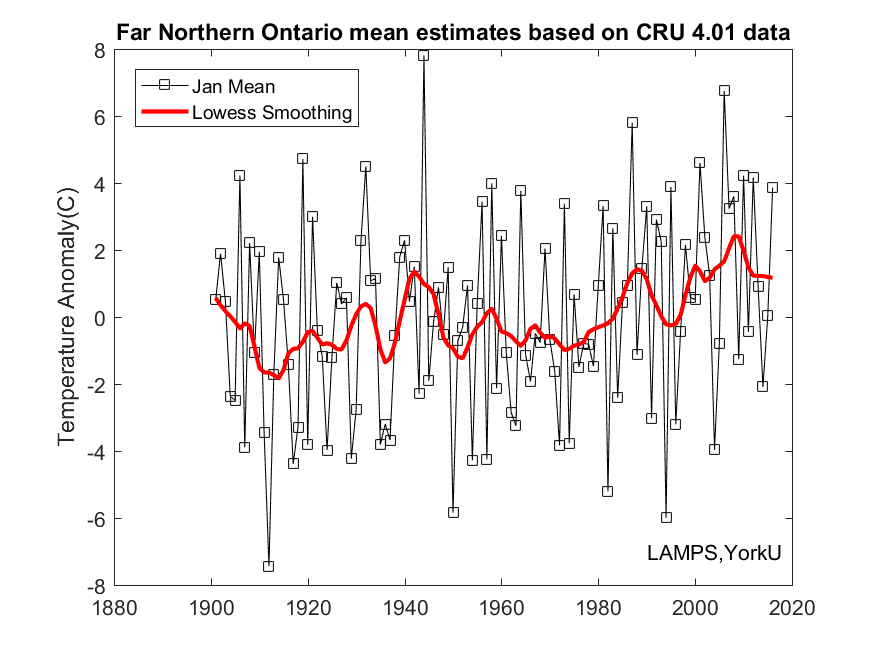
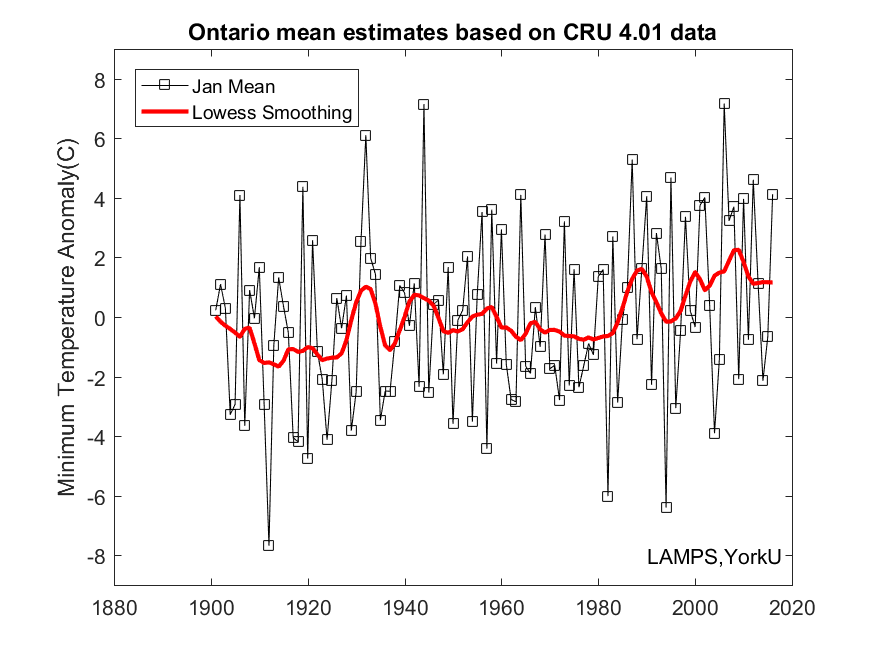
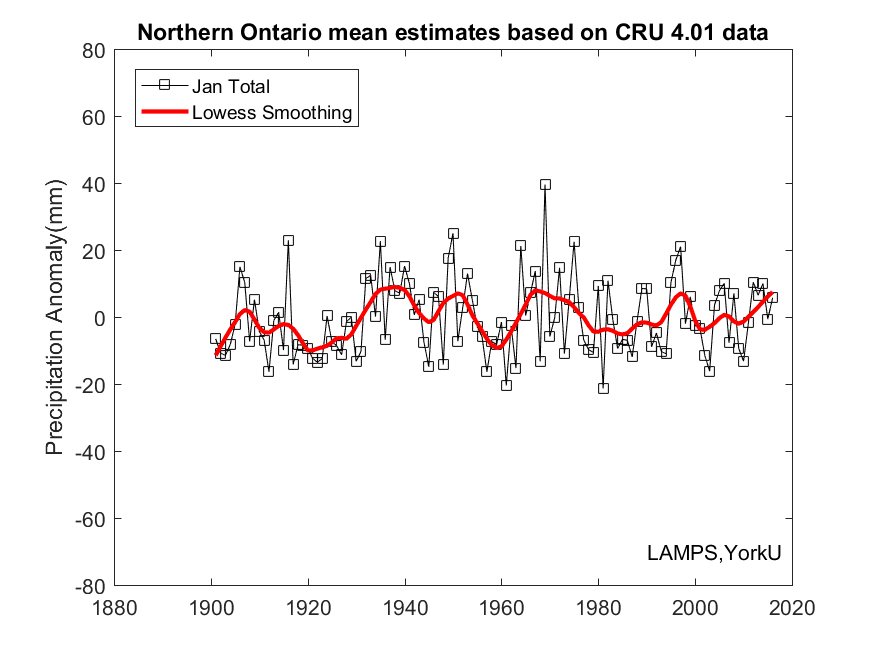
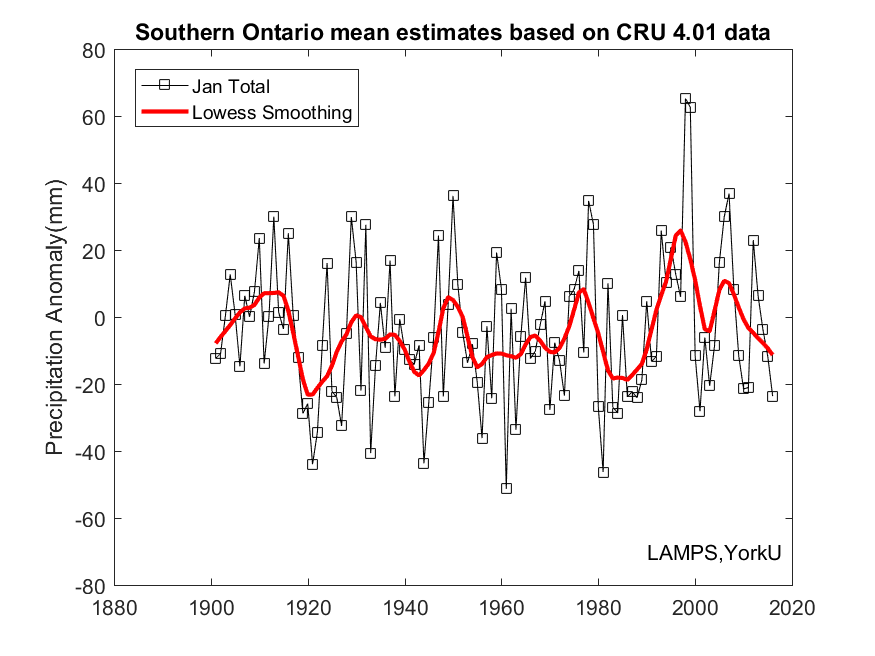
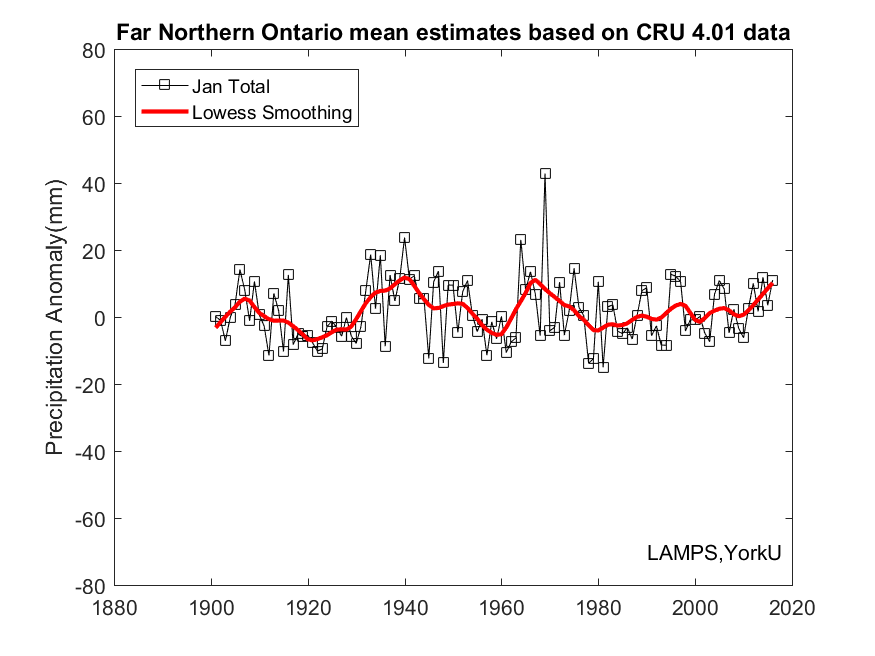
| Jan | 14 | 14 | 27 | 12 | 8 | 8 | 28 | 7 | 22 | 21 | 28 | 19 | 45 | 37 | 93 | 18 |
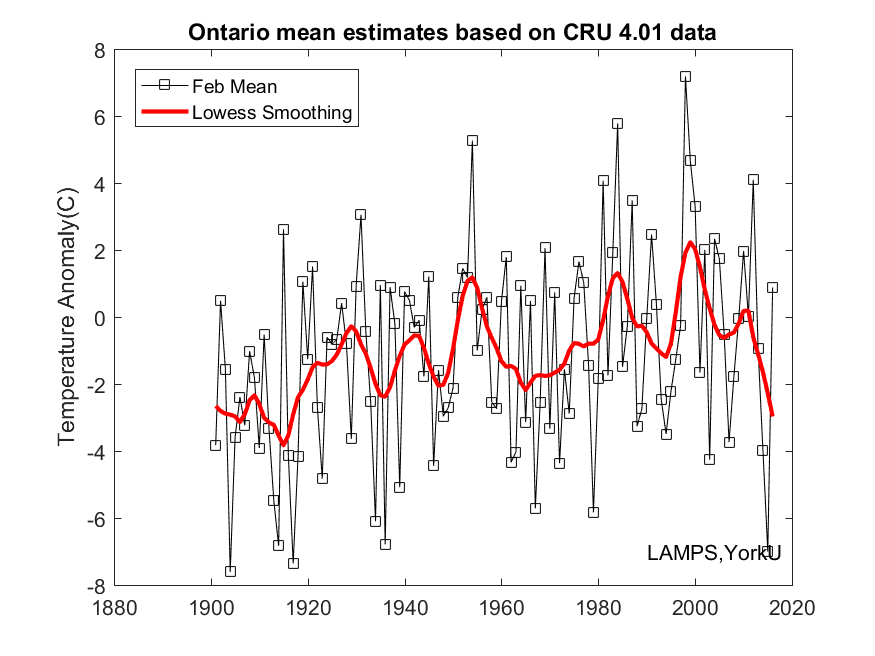
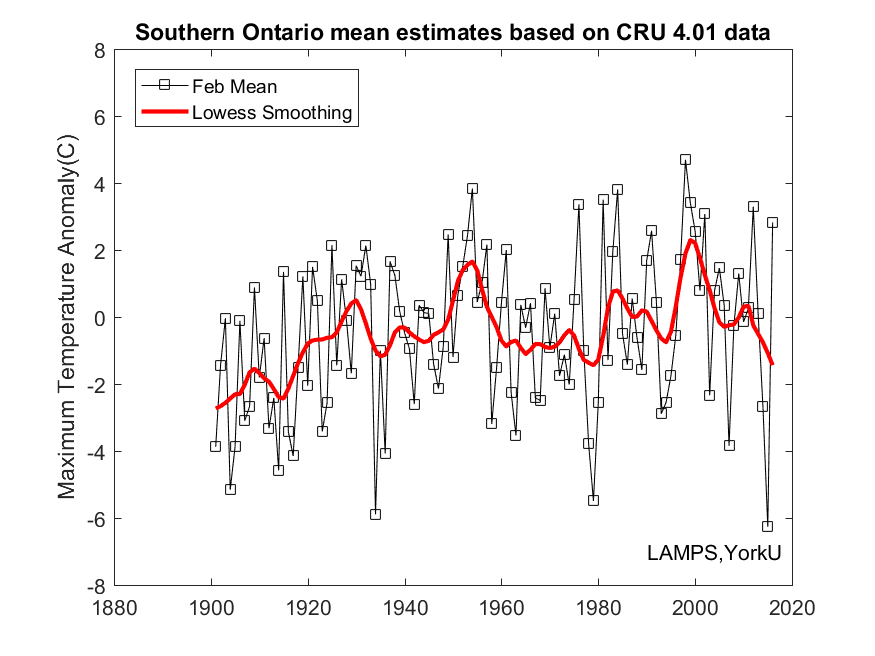
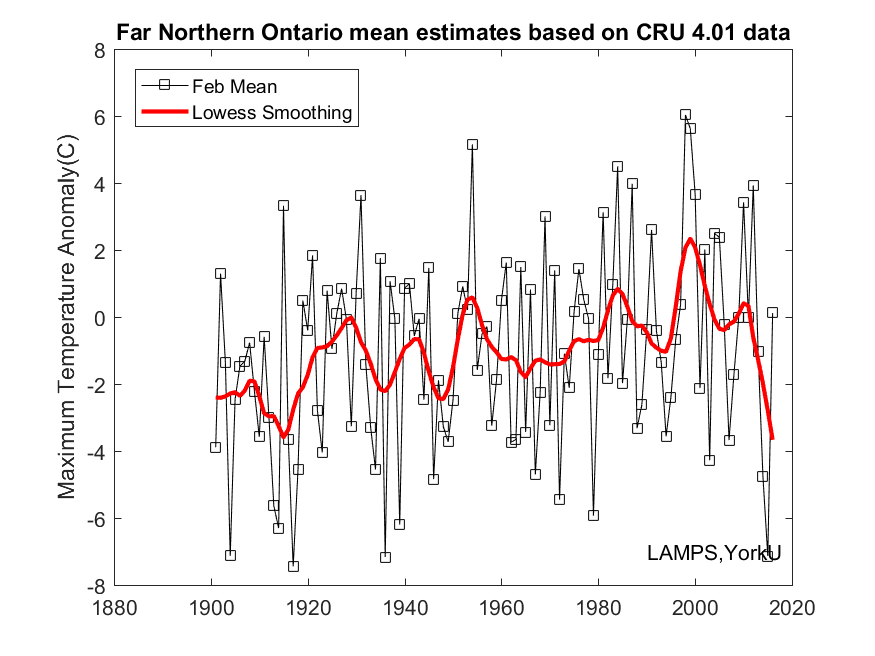
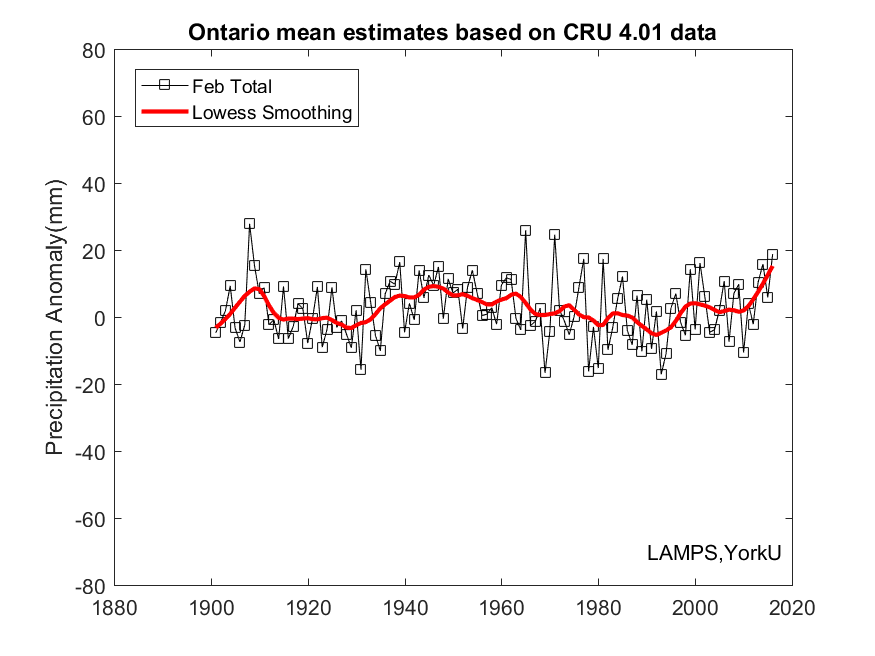
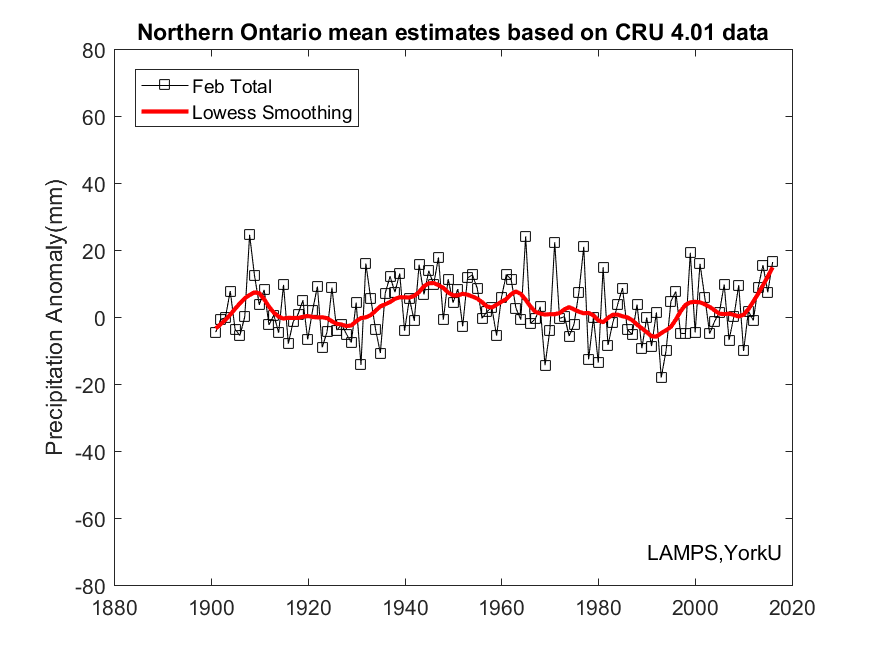
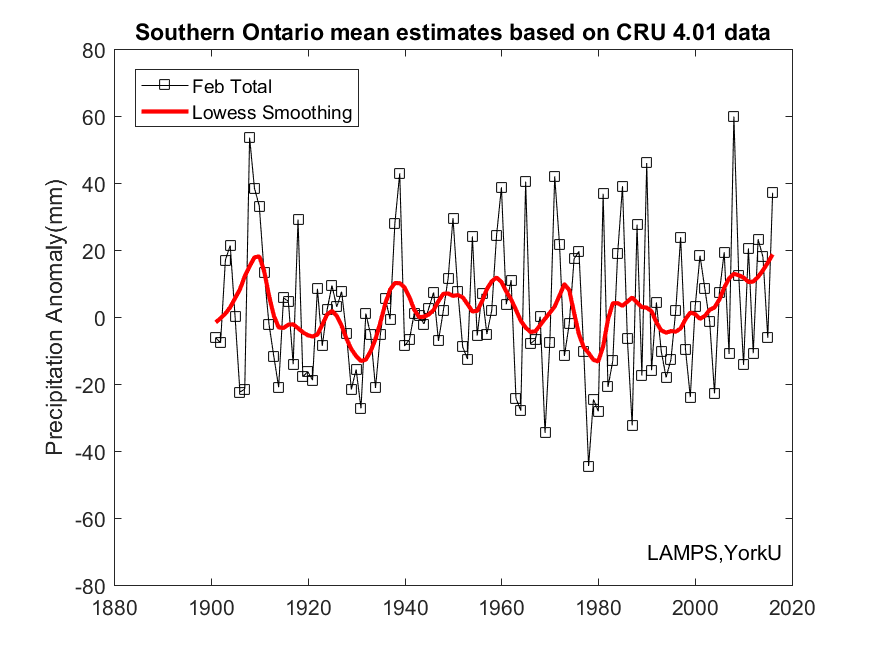
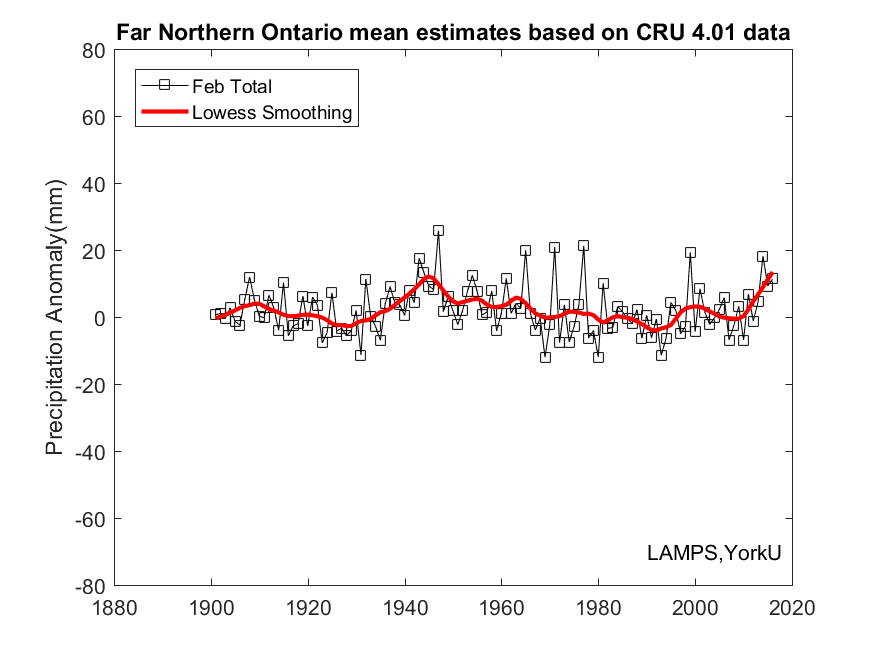
| Feb | 30 | 34 | 11 | 40 | 26 | 29 | 14 | 41 | 29 | 32 | 9 | 40 | 4 | 7 | 10 | 12 |
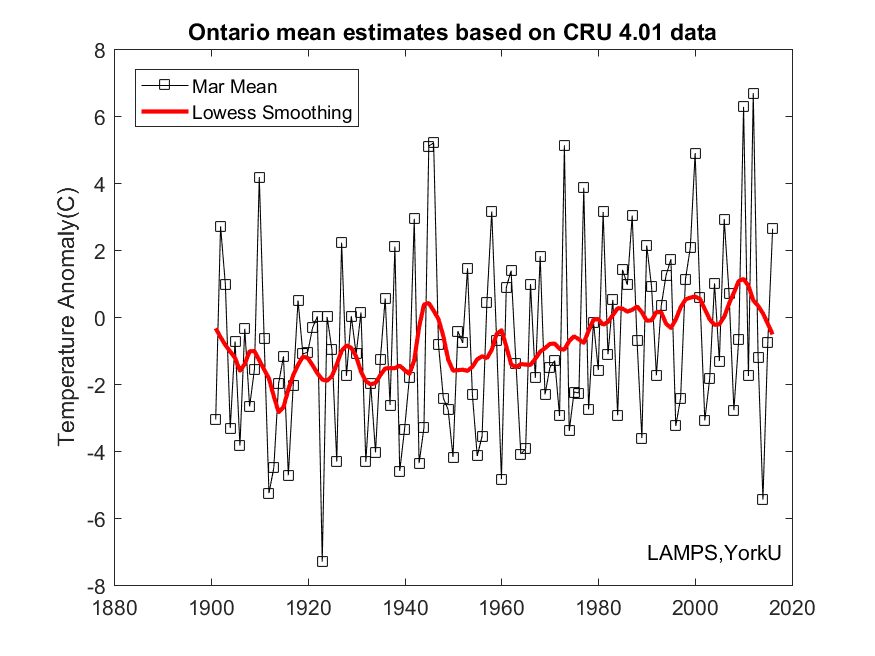
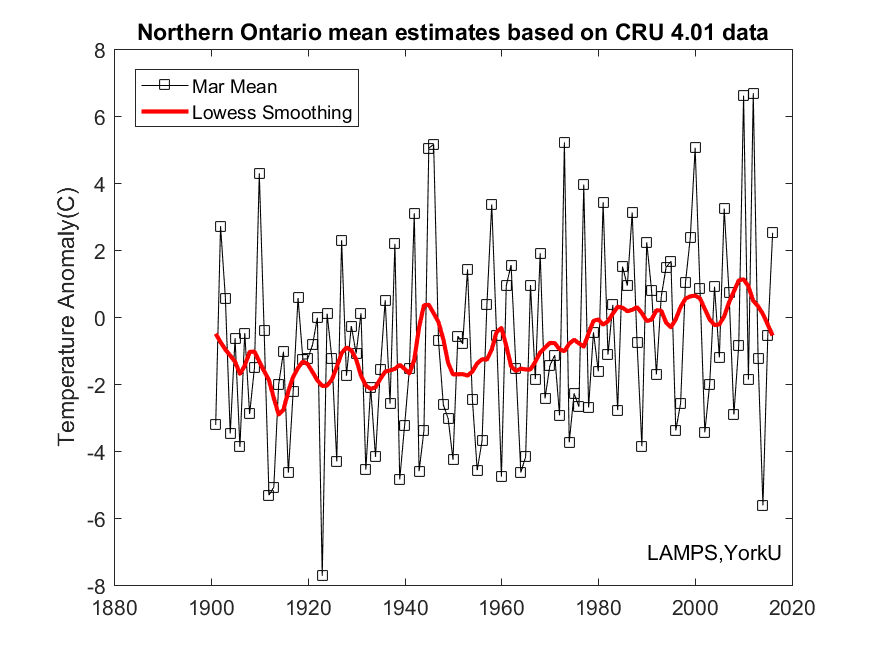
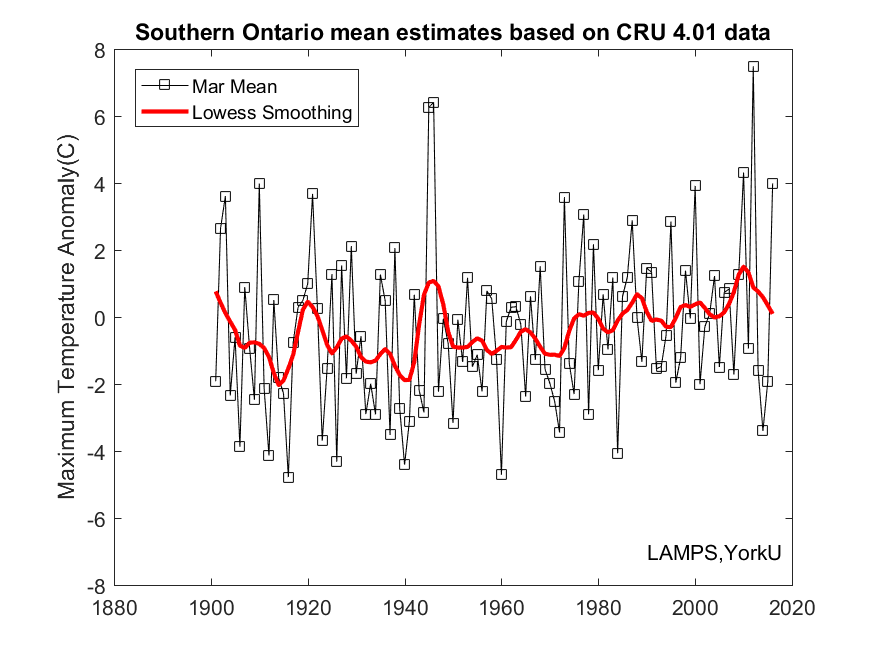
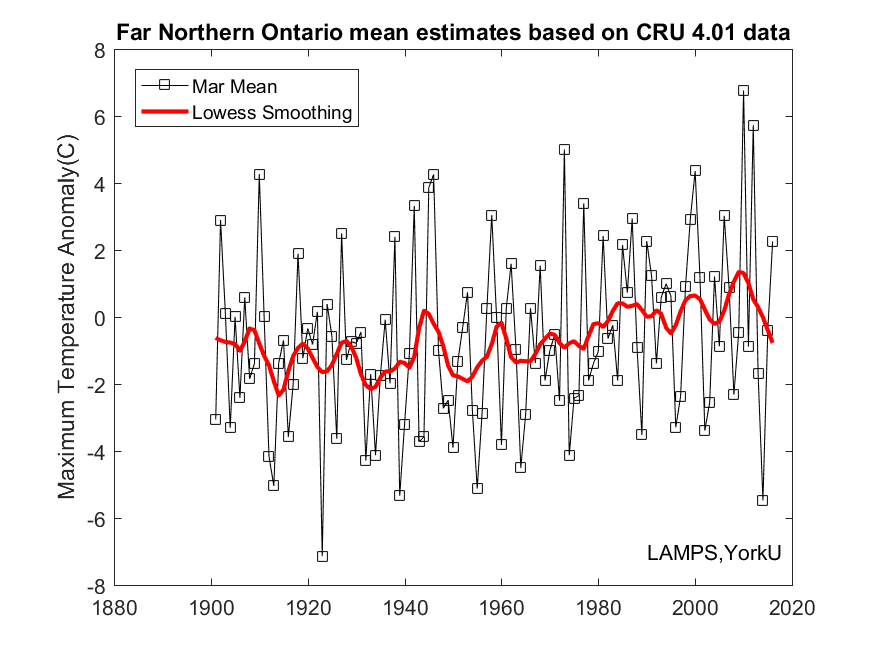
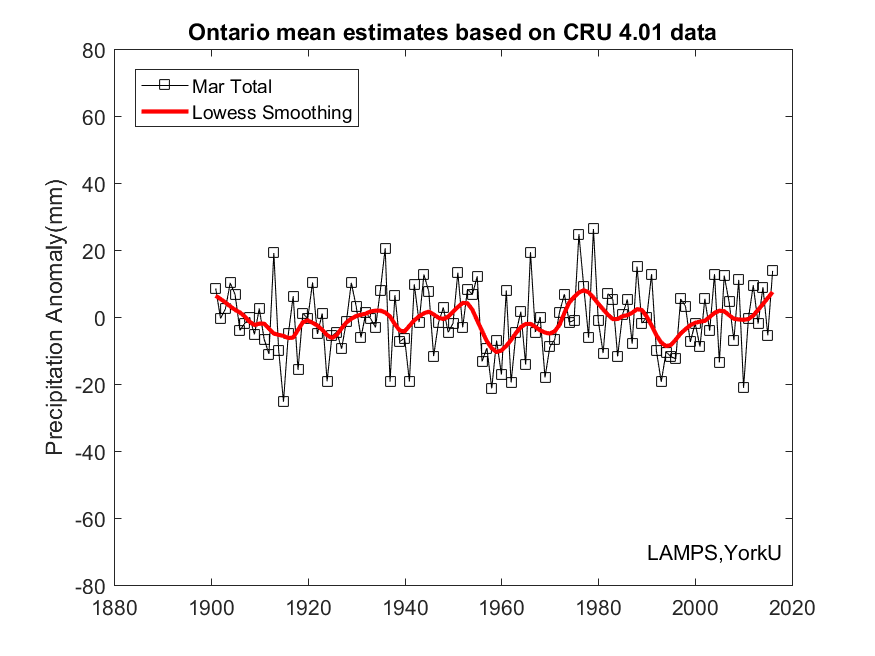
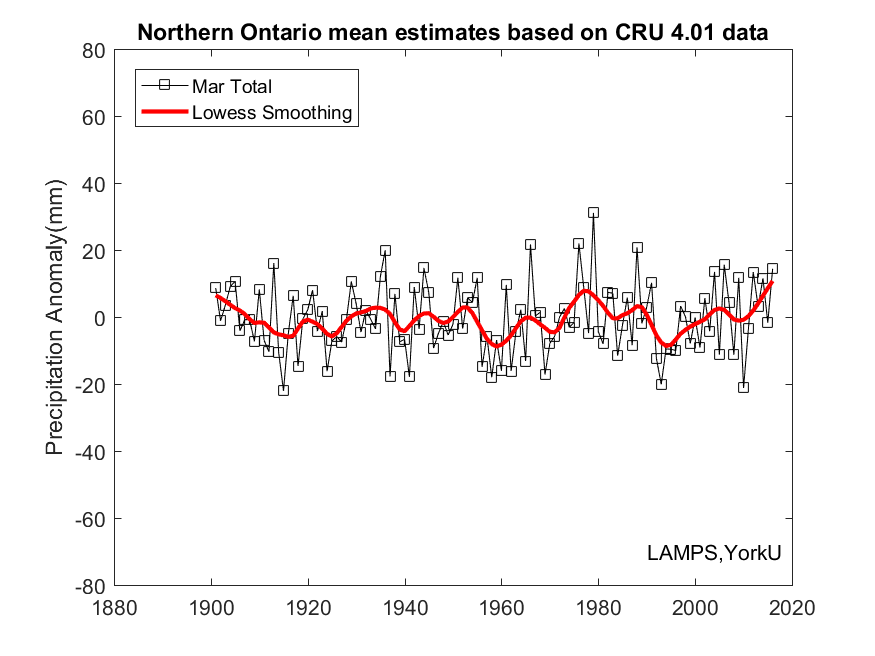
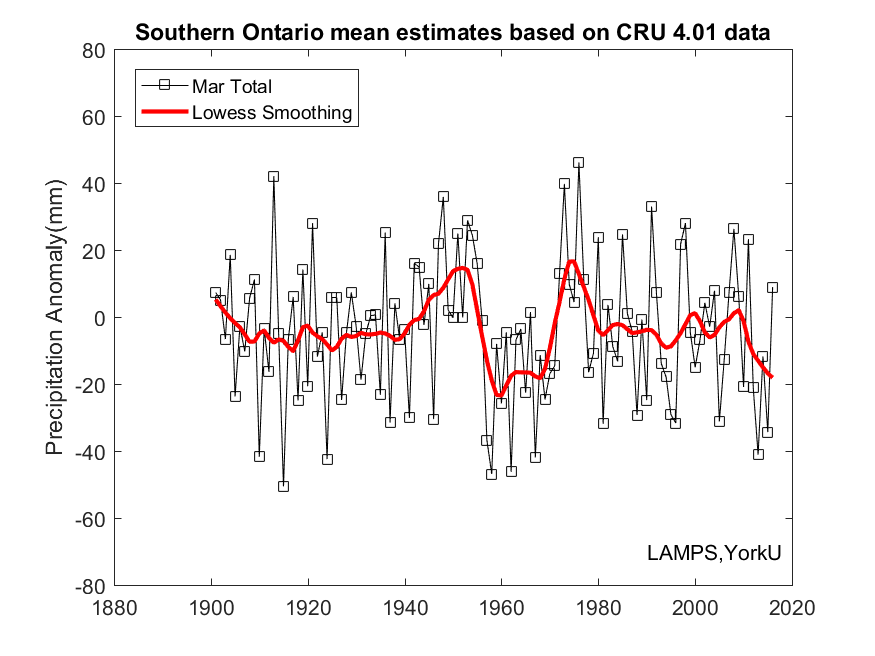
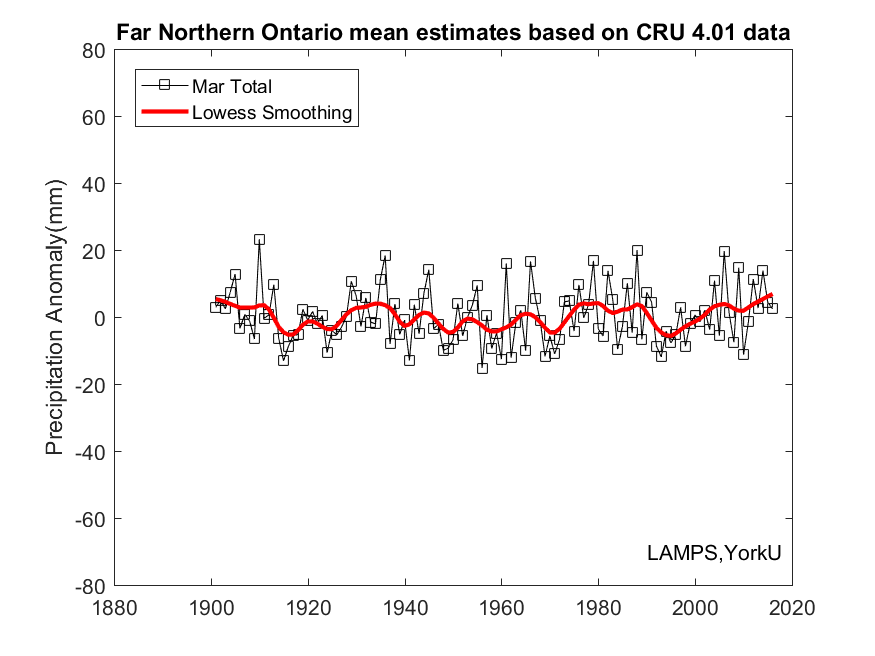
| Mar | 15 | 15 | 9 | 19 | 15 | 16 | 8 | 23 | 11 | 13 | 5 | 19 | 7 | 9 | 28 | 42 |
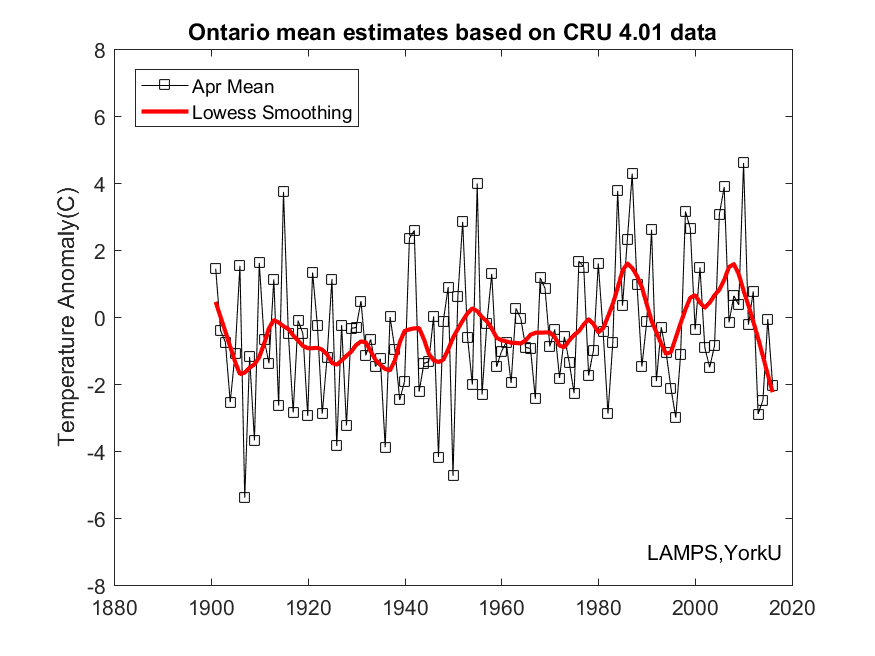
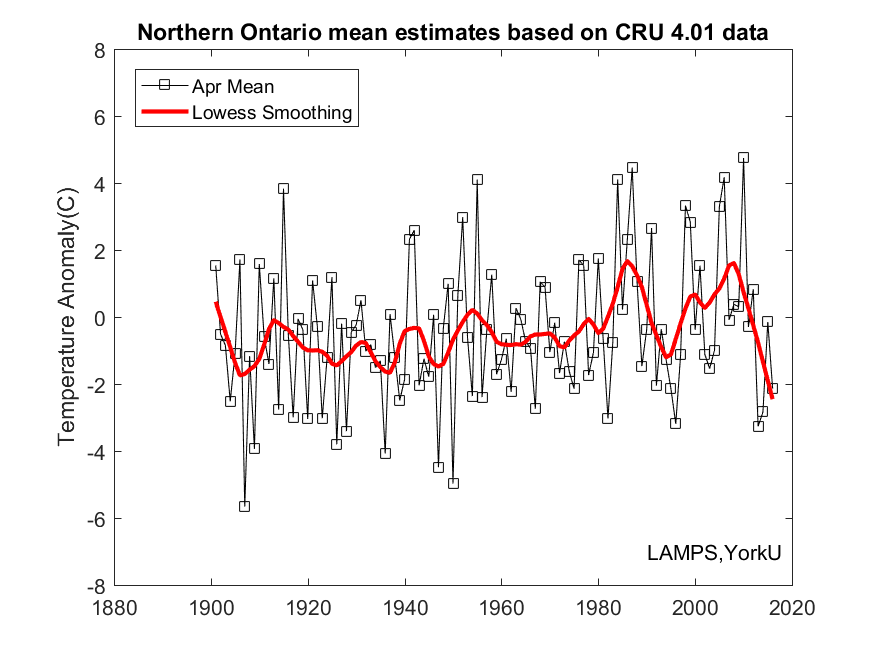
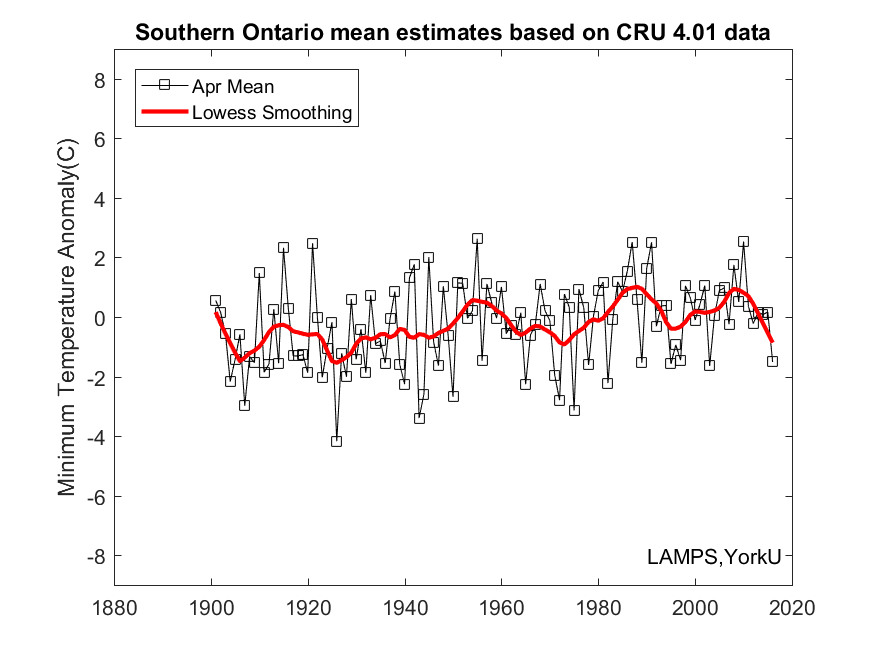
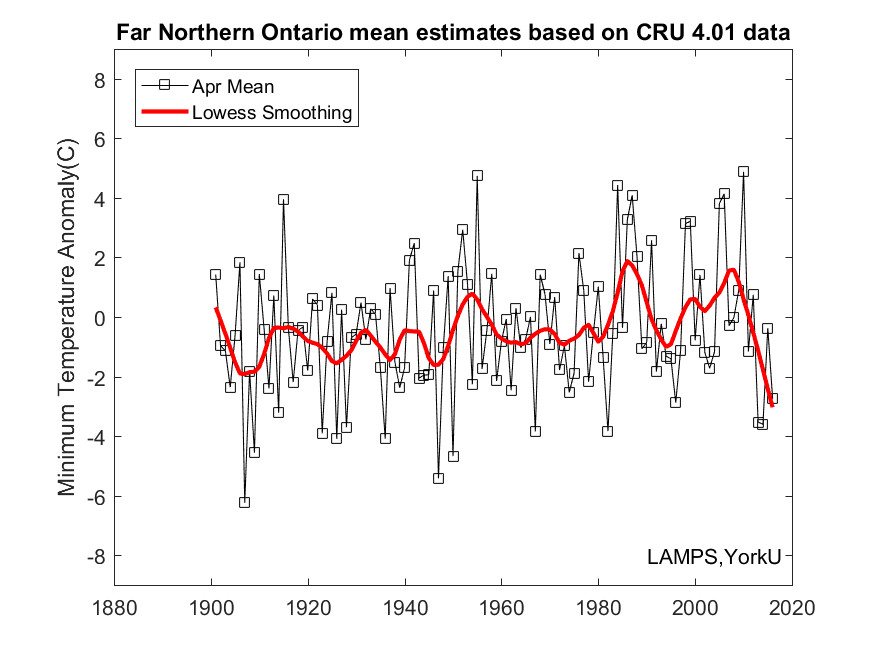
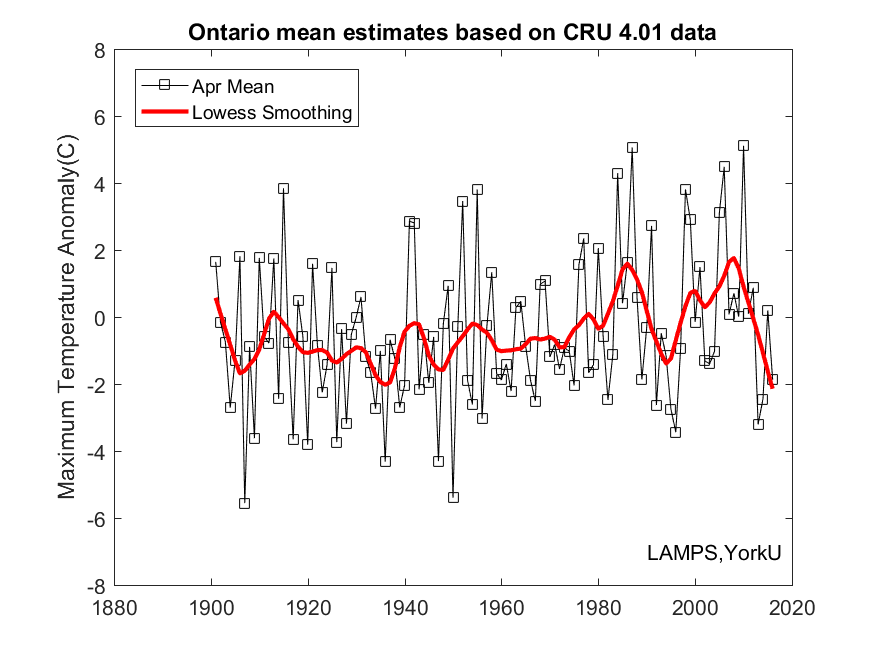
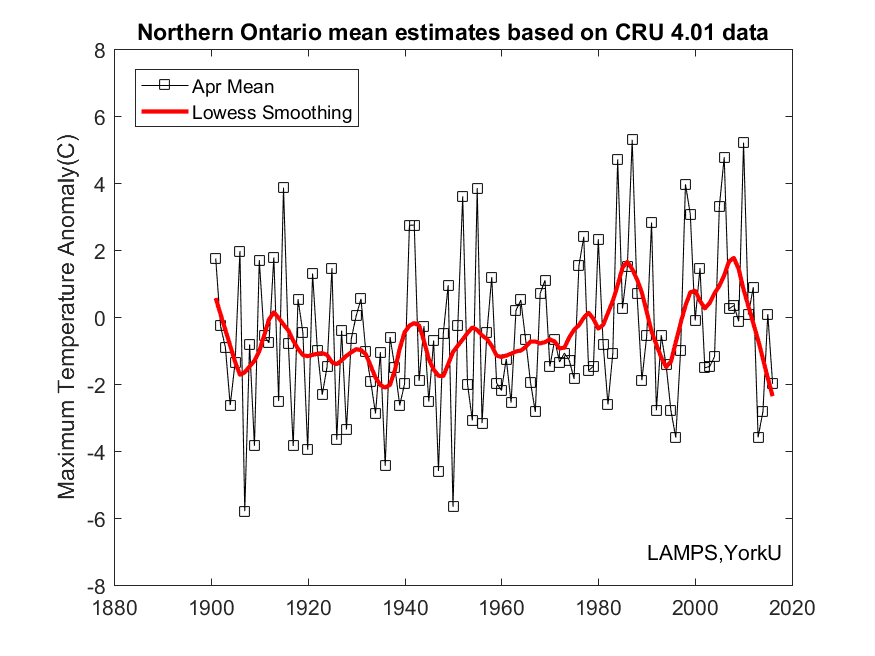
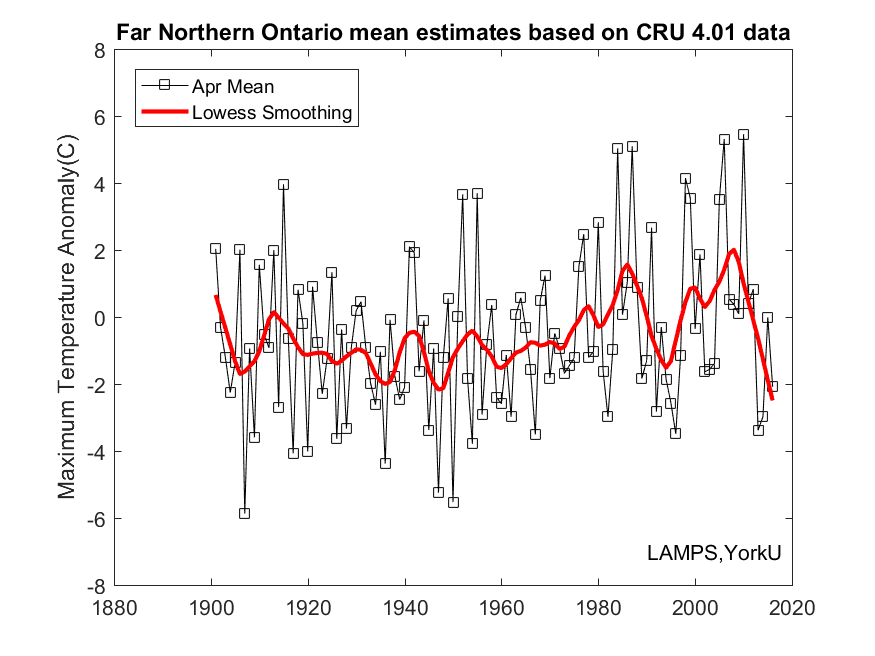
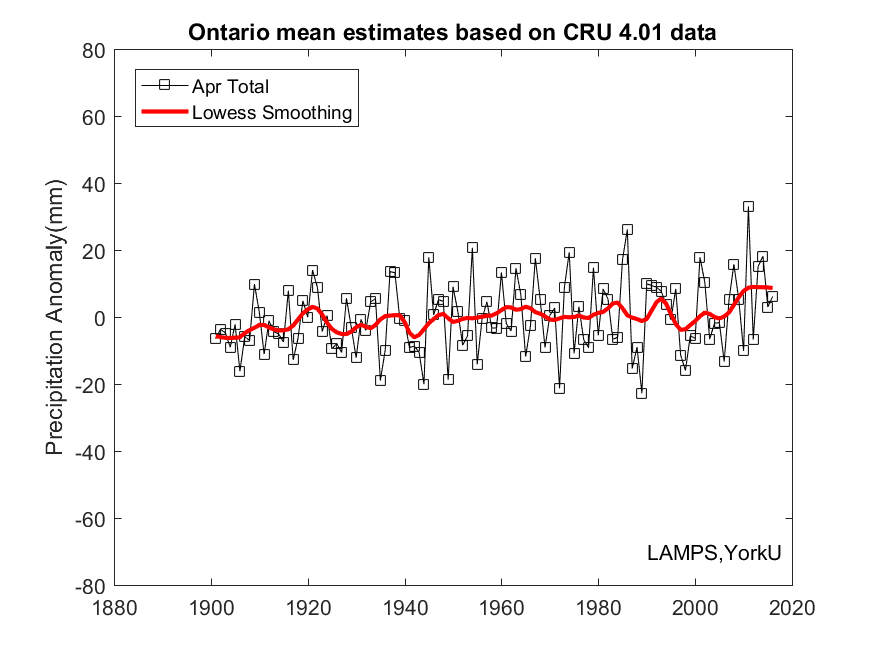
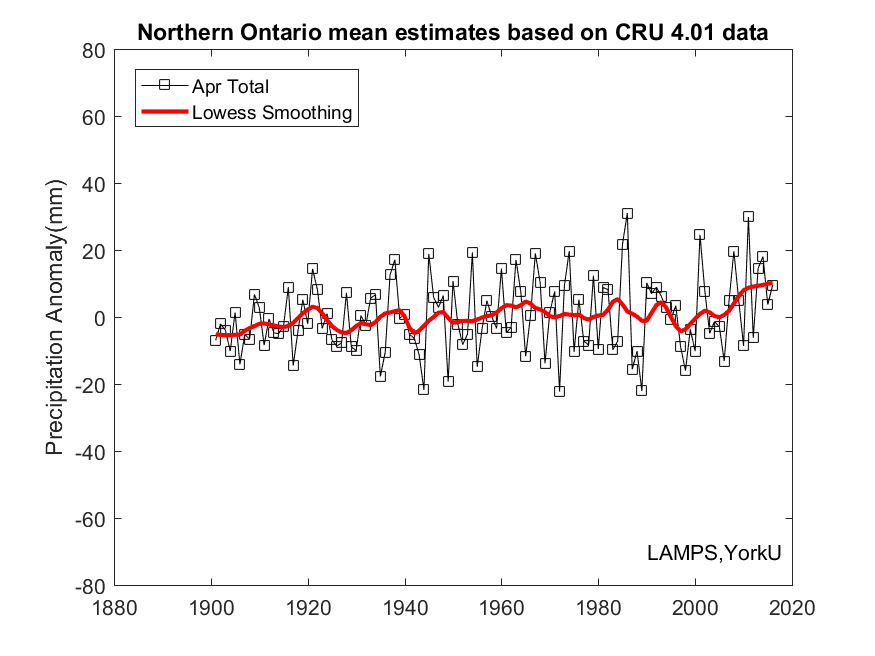
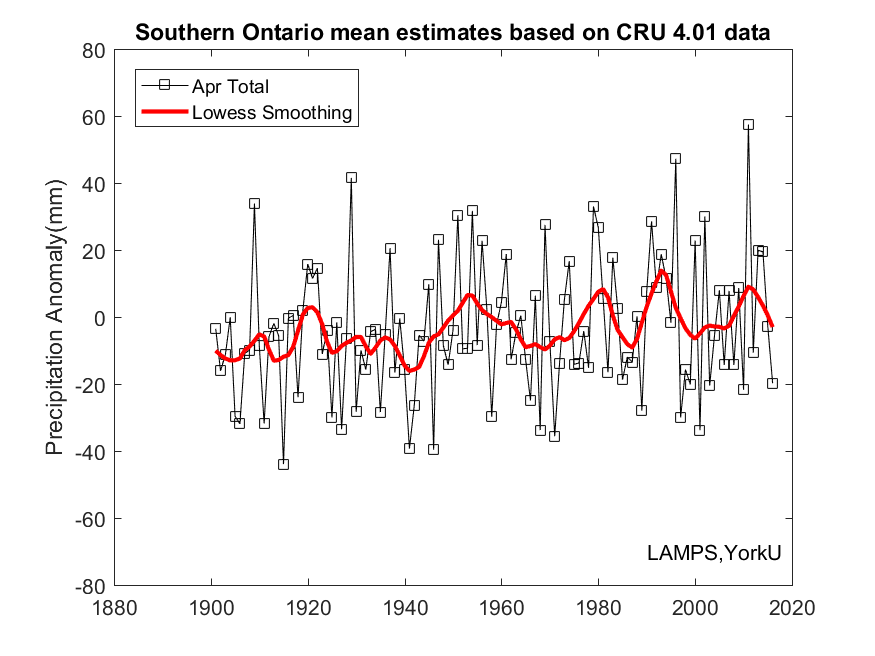
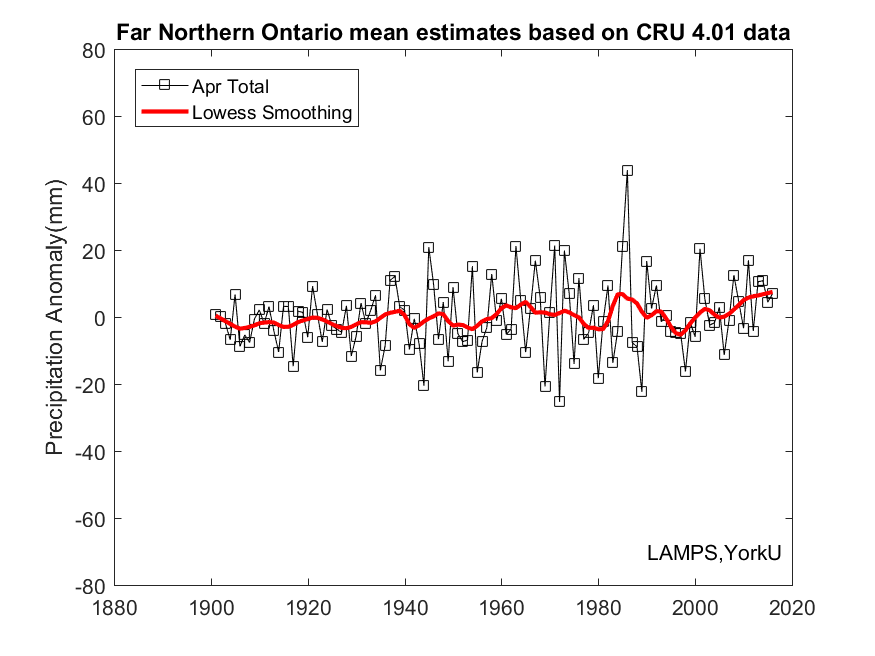
| Apr | 94 | 93 | 82 | 96 | 97 | 99 | 89 | 102 | 85 | 89 | 77 | 88 | 31 | 21 | 94 | 24 |
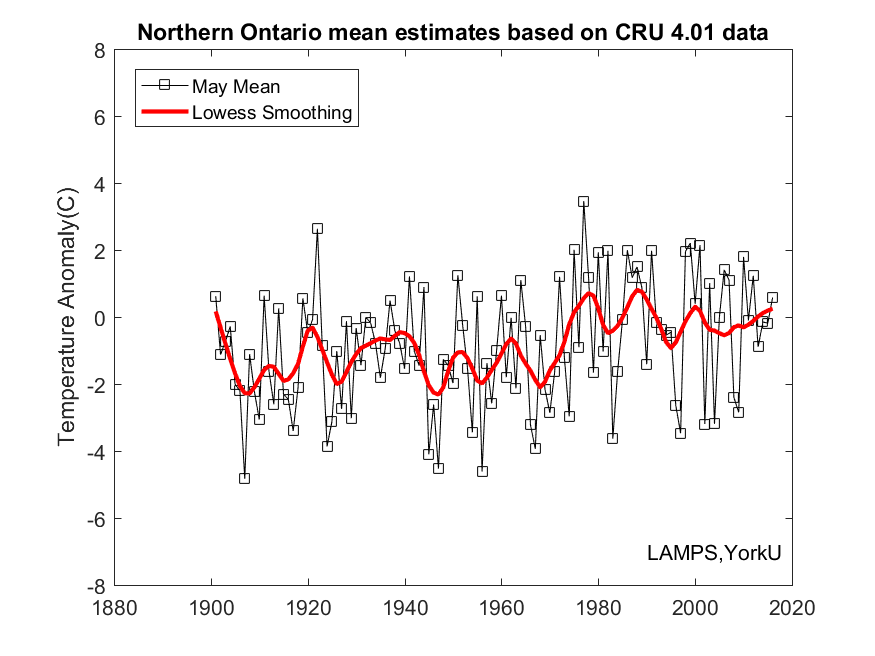
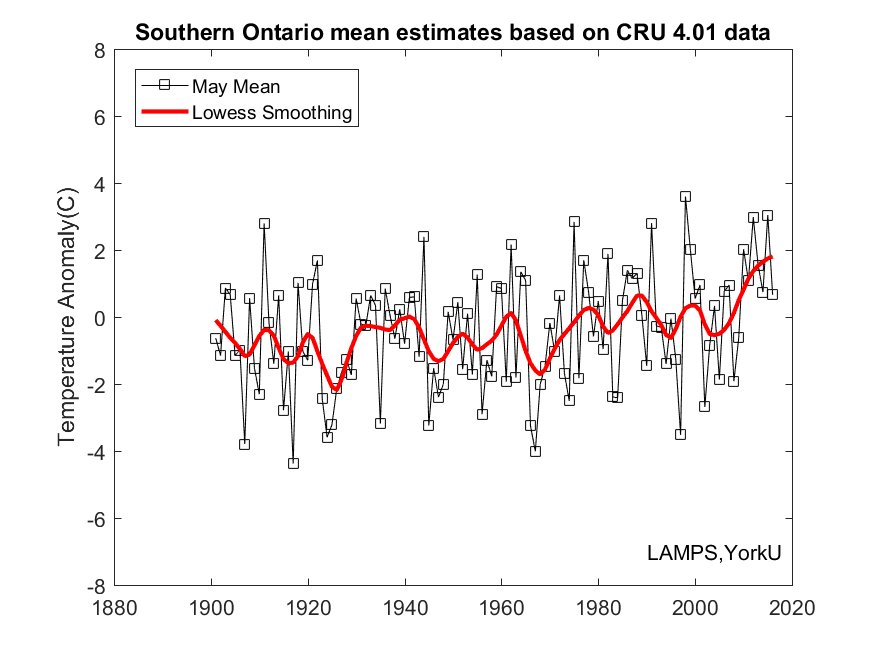
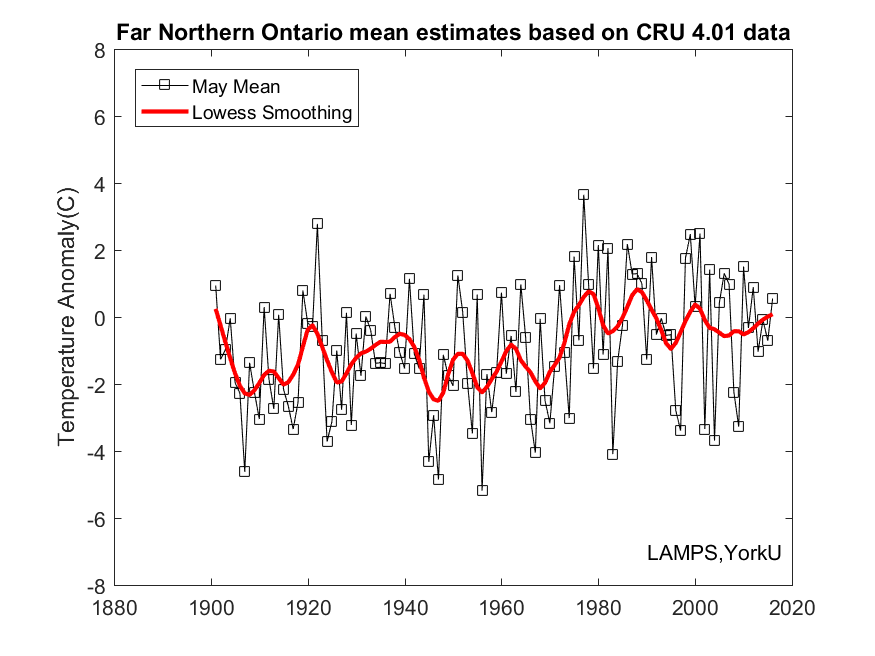
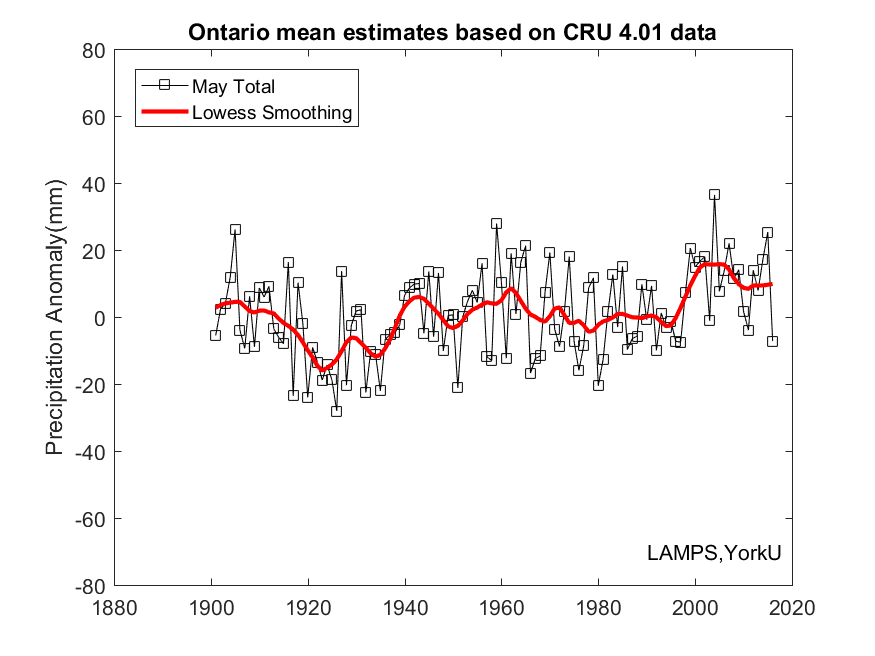
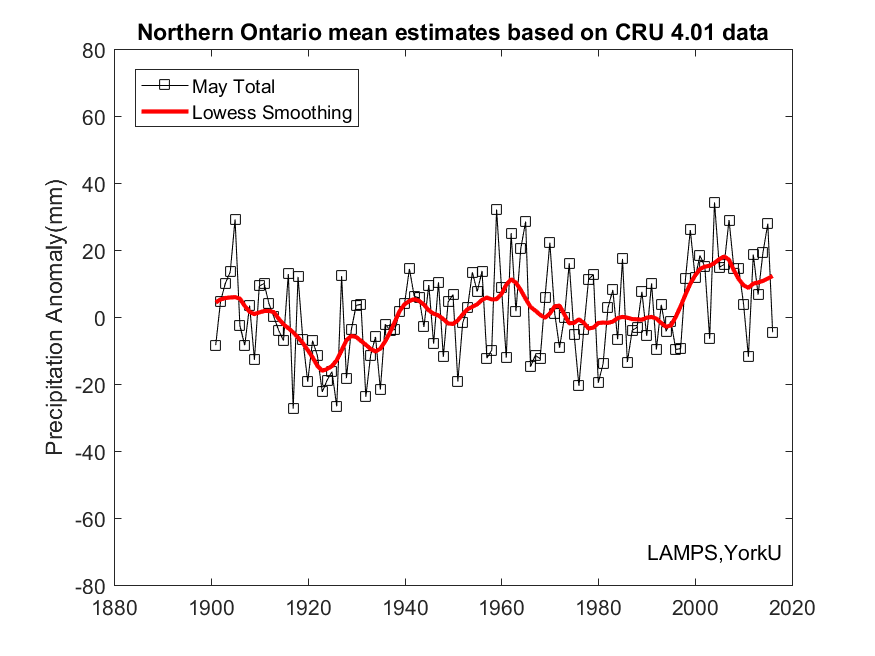
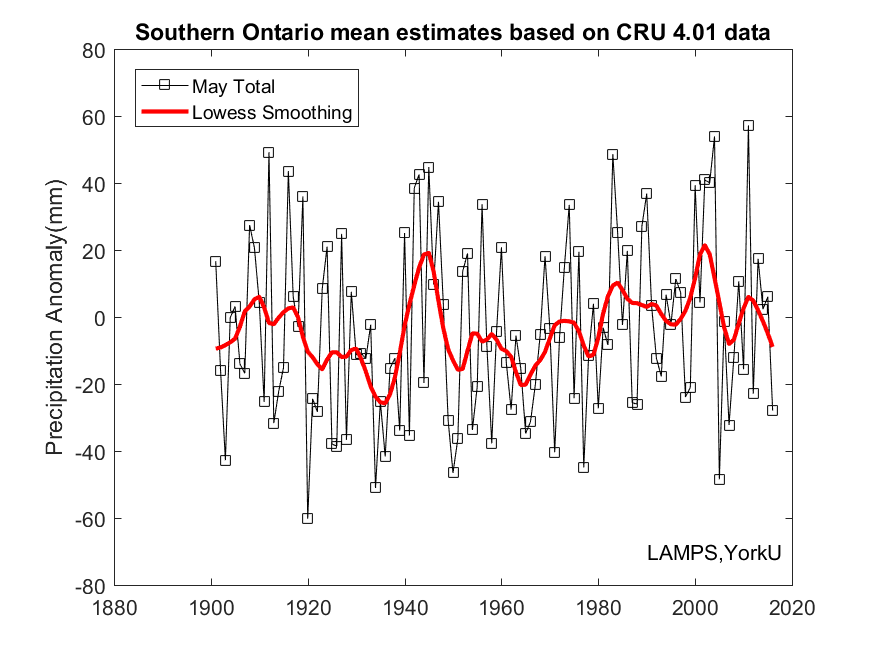
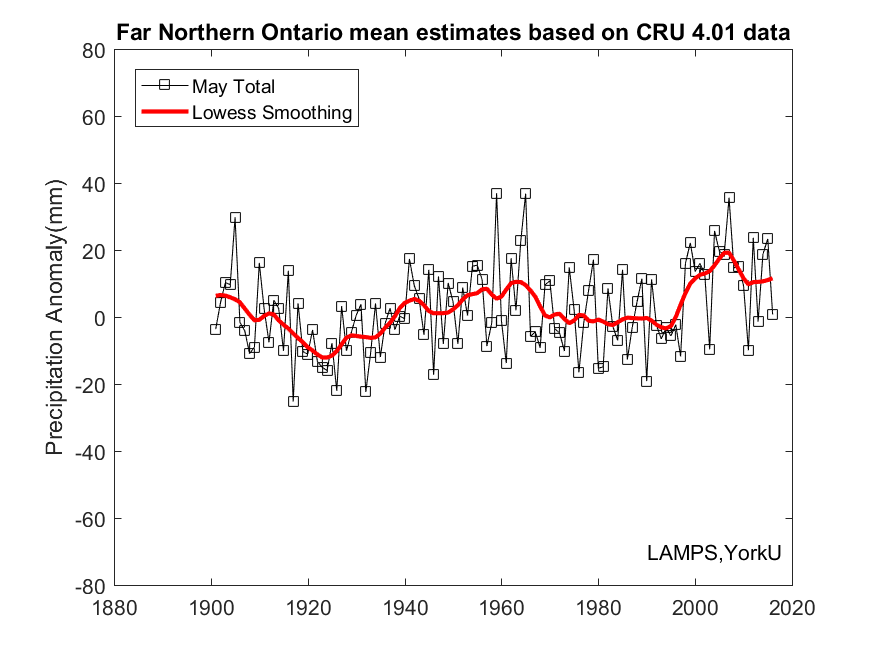
| May | 28 | 29 | 34 | 30 | 33 | 35 | 30 | 38 | 24 | 24 | 40 | 25 | 82 | 76 | 94 | 57 |
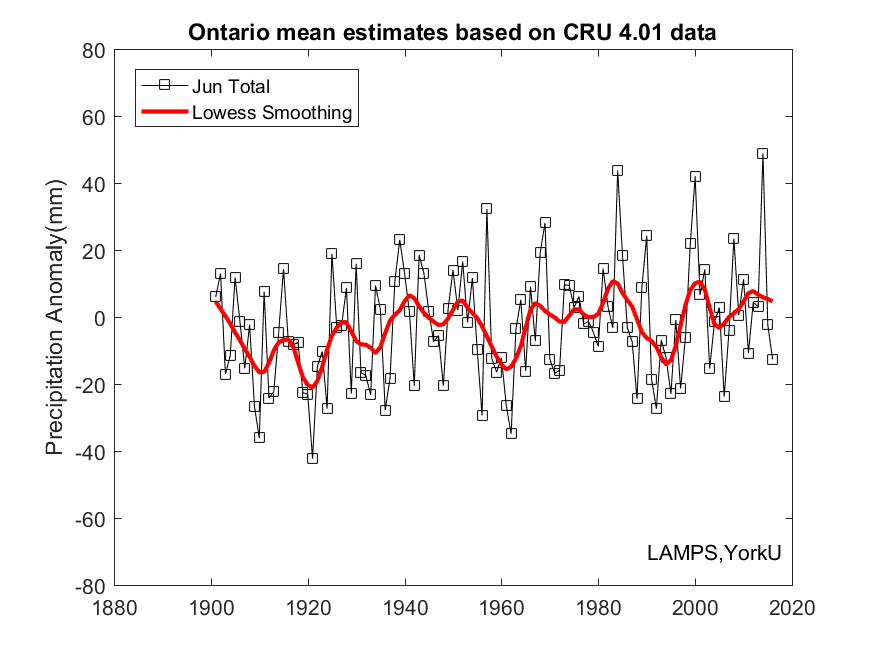
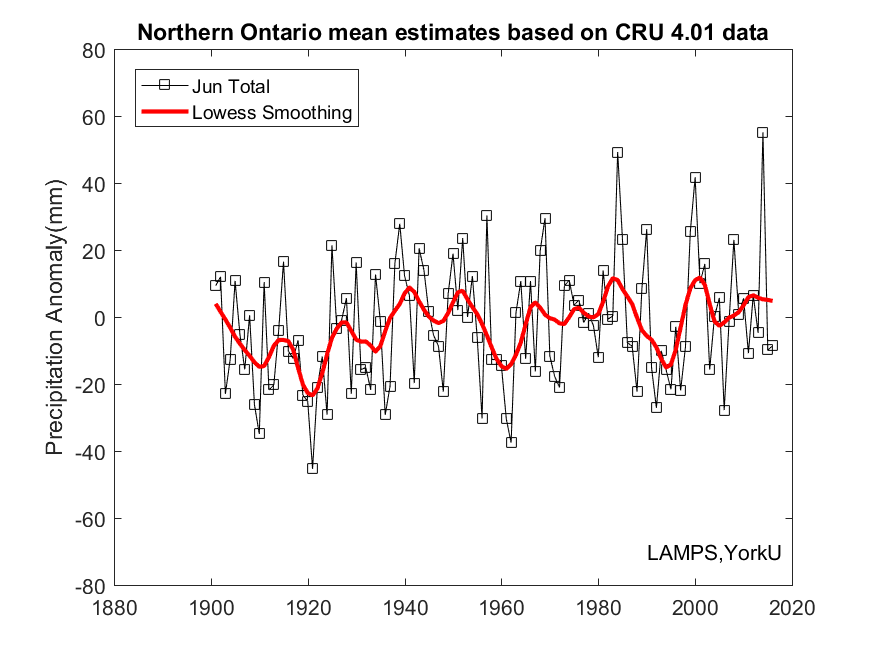
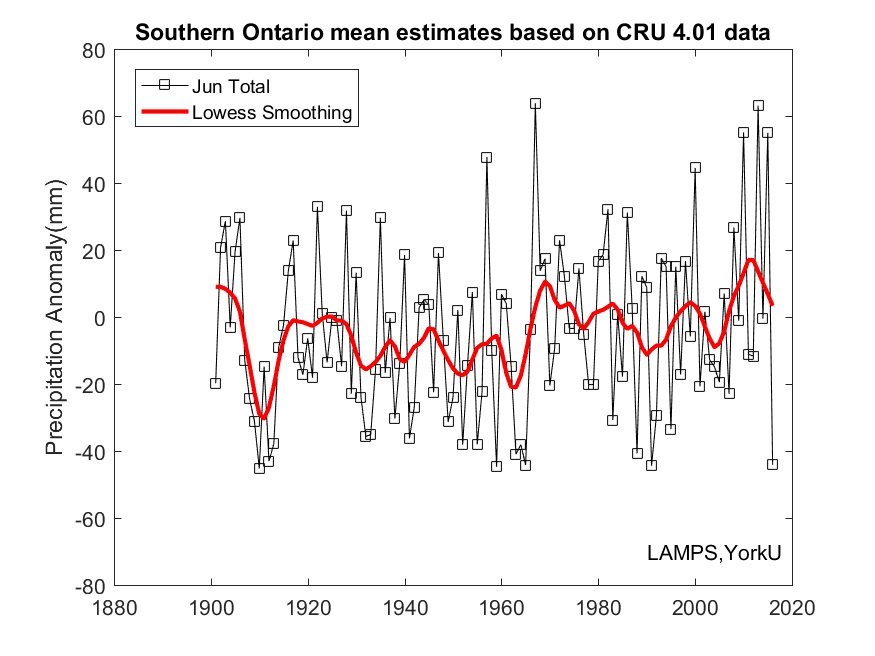
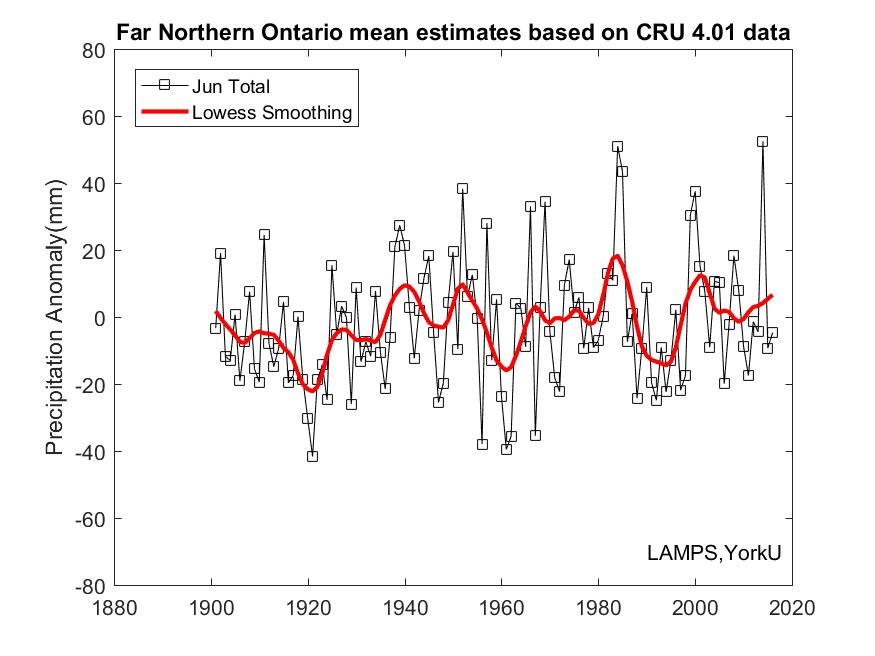
| Jun | 50 | 50 | 30 | 53 | 54 | 57 | 37 | 58 | 45 | 50 | 27 | 49 | 82 | 67 | 112 | 60 |
| Jul | 30 | 38 | 10 | 46 | 22 | 26 | 7 | 36 | 44 | 49 | 17 | 52 | 33 | 28 | 96 | 31 |
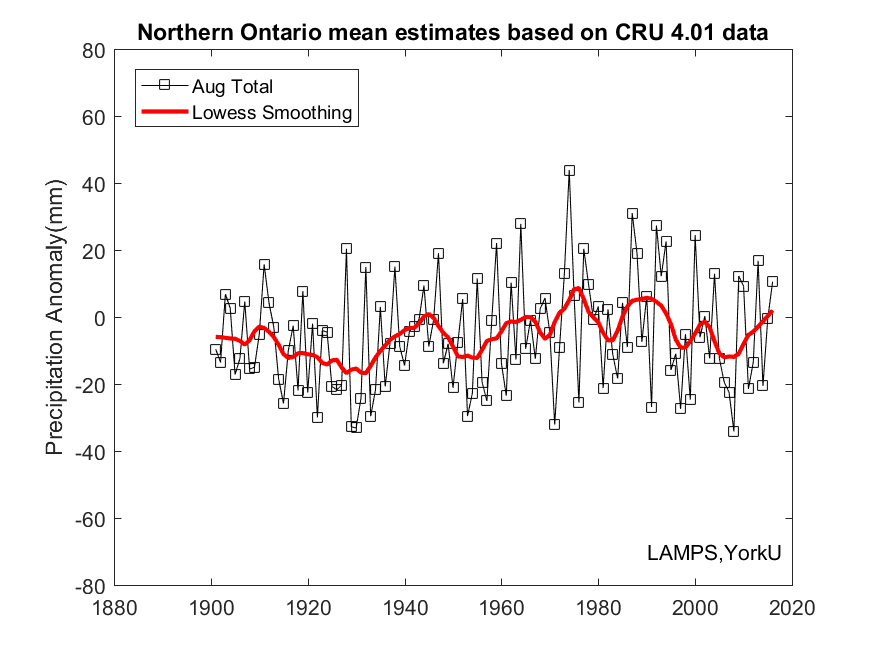
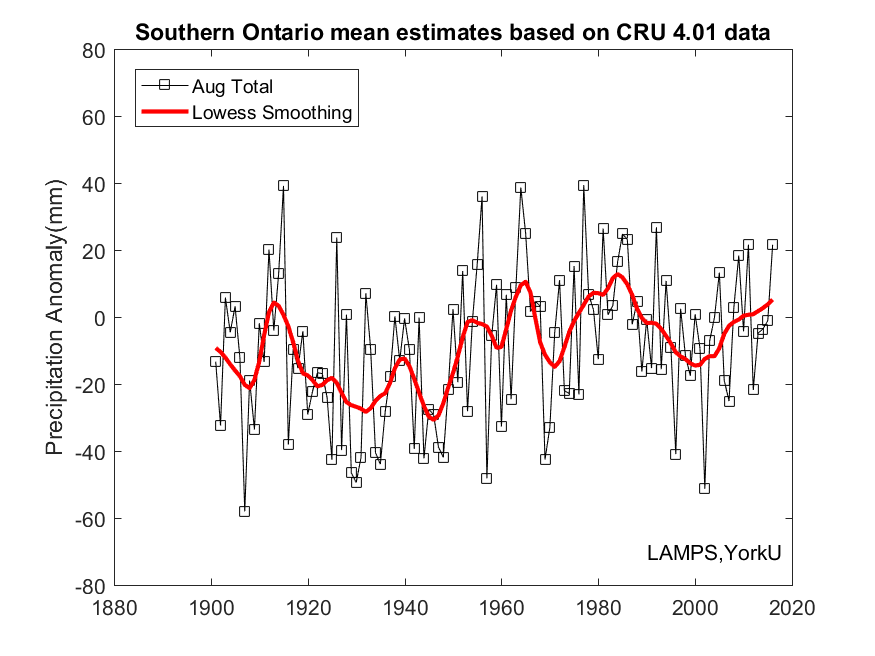
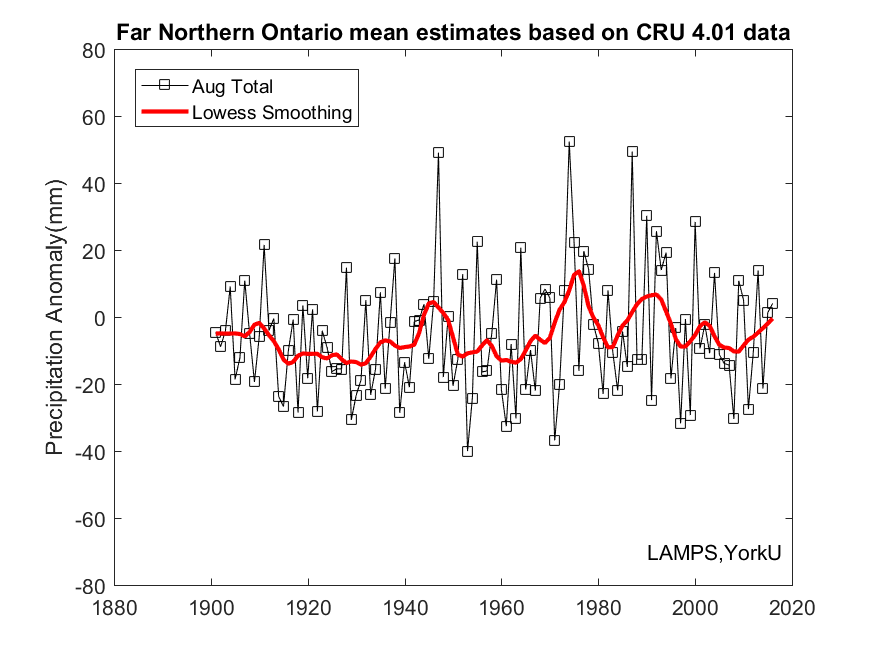
| Aug | 13 | 15 | 1 | 21 | 11 | 12 | 1 | 22 | 17 | 22 | 2 | 22 | 18 | 21 | 12 | 33 |
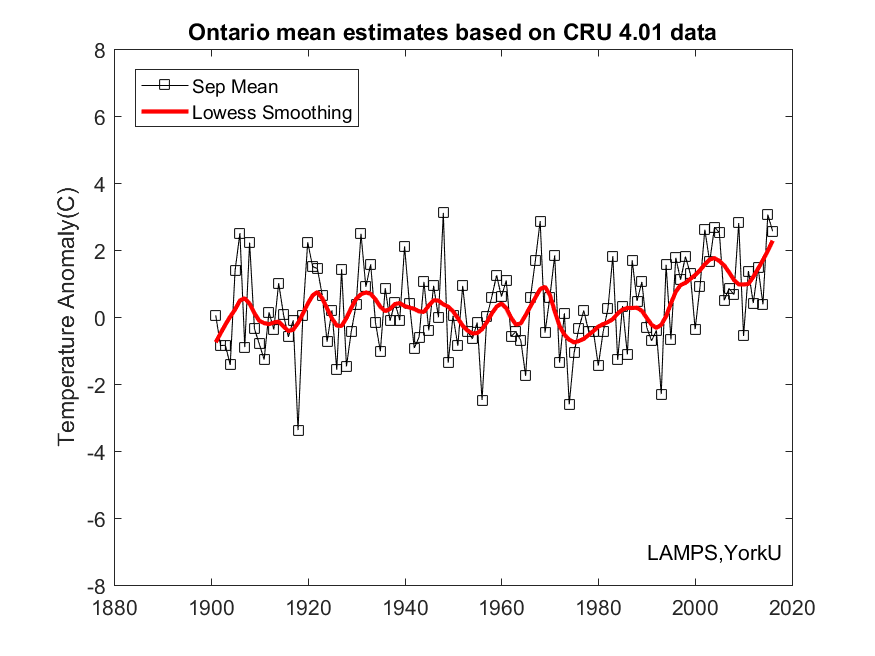
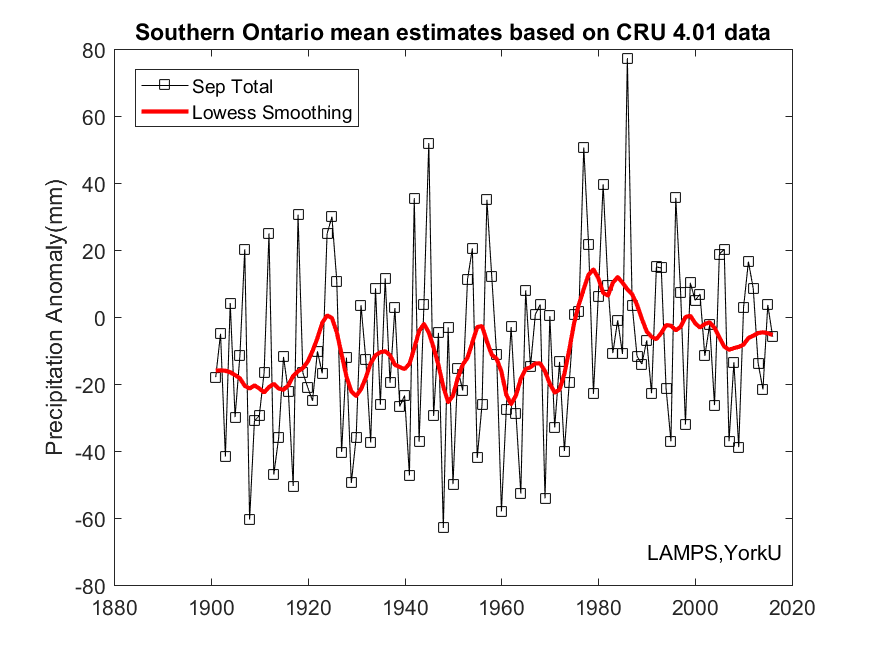
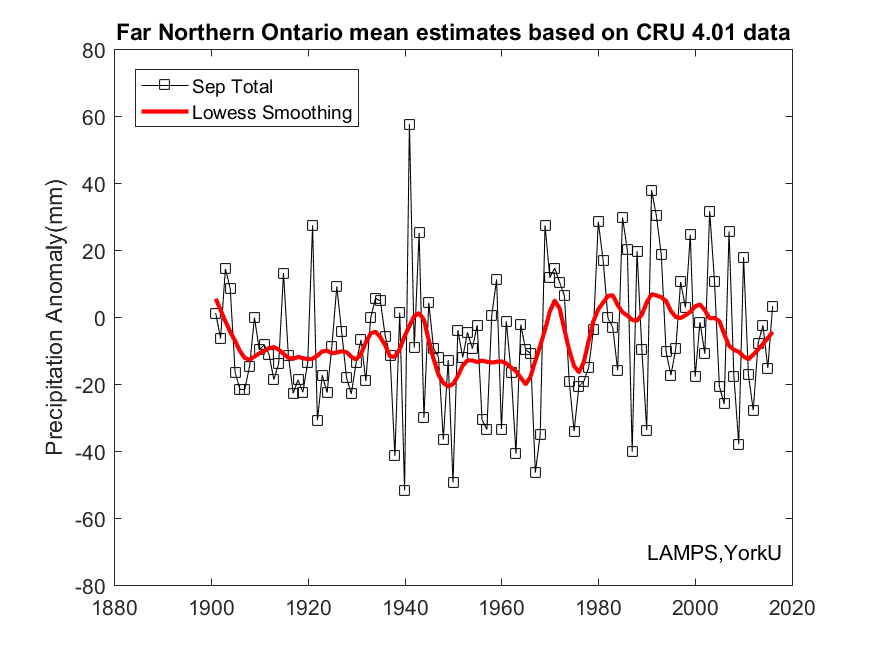
| Sep | 7 | 9 | 4 | 11 | 2 | 2 | 3 | 4 | 14 | 14 | 7 | 15 | 24 | 21 | 51 | 31 |
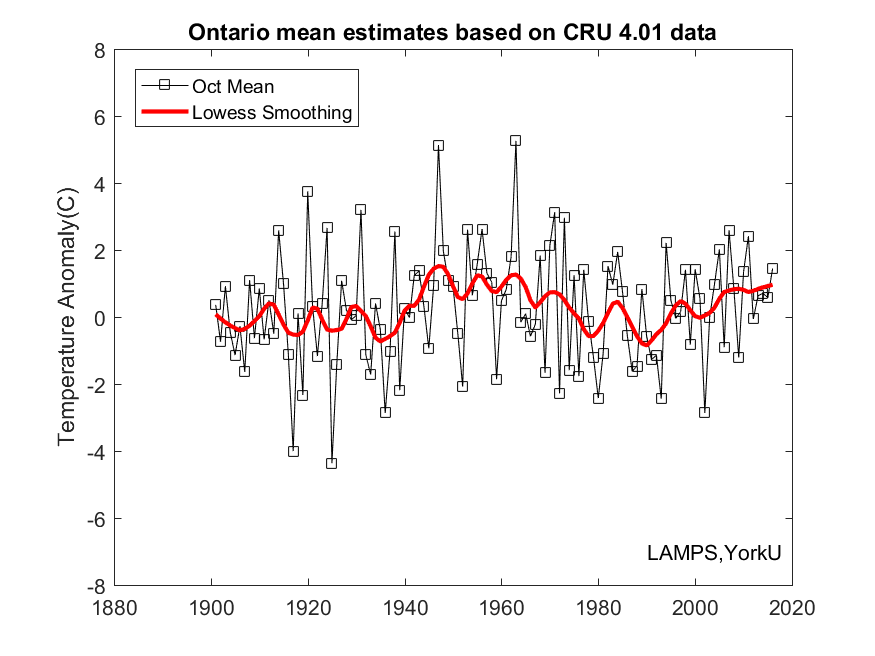
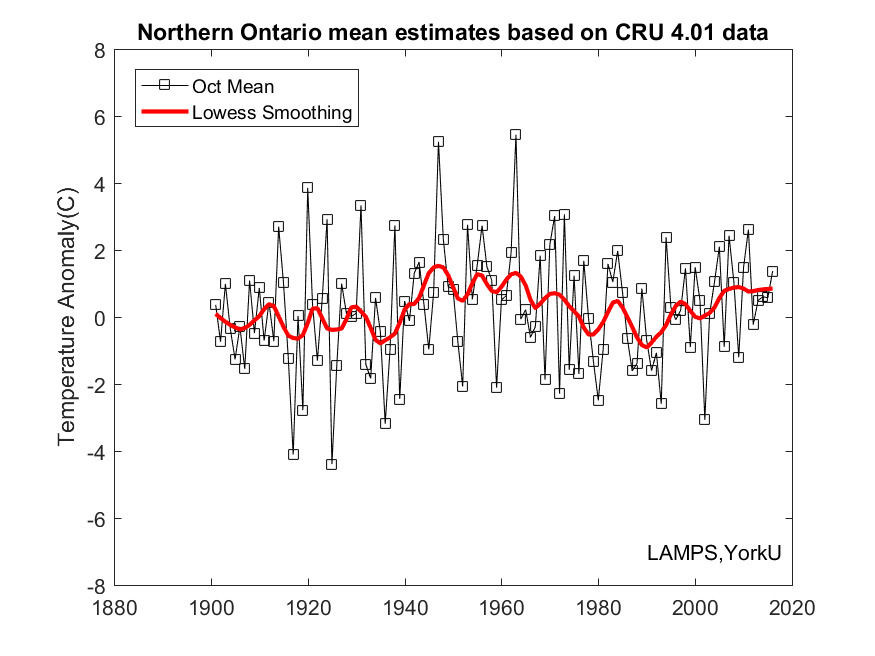
| Oct | 23 | 29 | 11 | 37 | 21 | 22 | 5 | 33 | 32 | 32 | 24 | 41 | 45 | 55 | 12 | 53 |
| Nov | 1 | 1 | 7 | 1 | 2 | 2 | 11 | 2 | 1 | 1 | 6 | 1 | 95 | 96 | 69 | 96 |
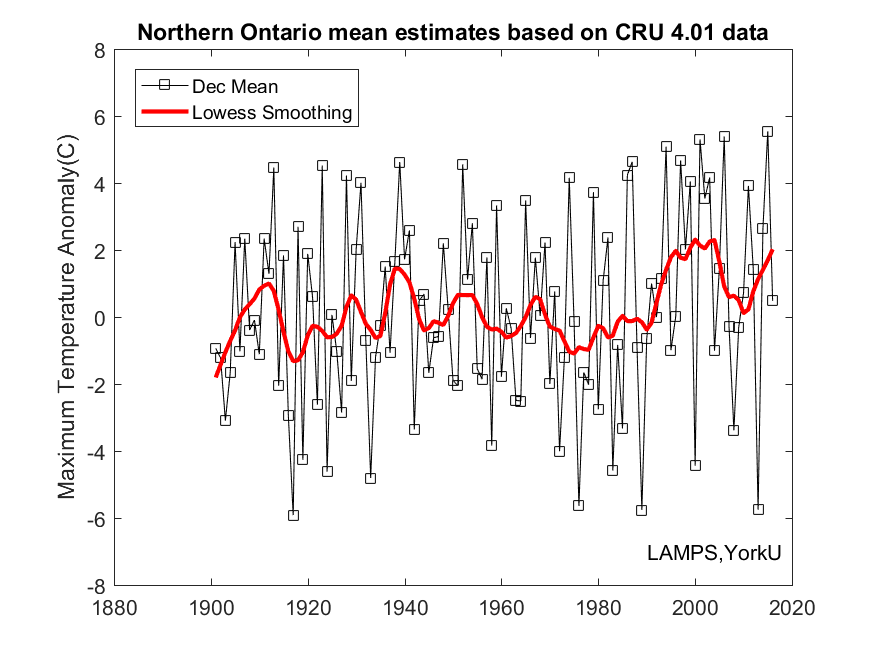
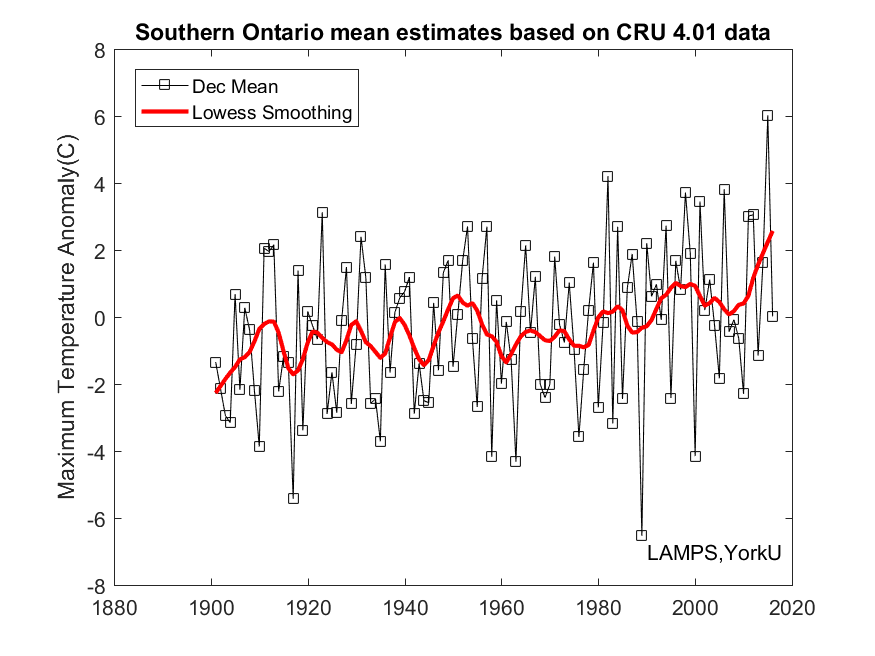
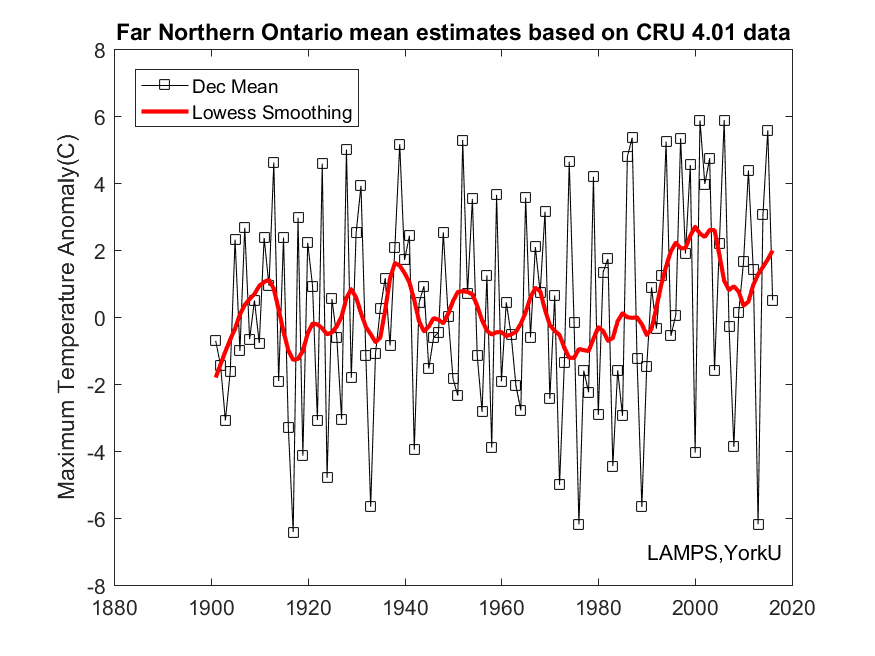
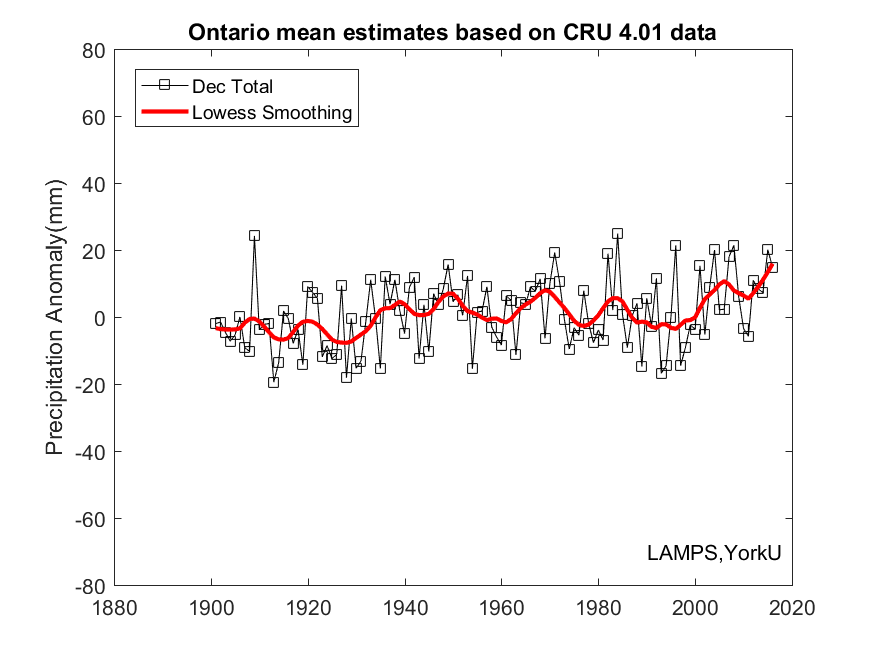
| Dec | 47 | 46 | 43 | 48 | 43 | 42 | 37 | 44 | 50 | 53 | 53 | 54 | 12 | 10 | 33 | 34 |